Google Charts
Overview #
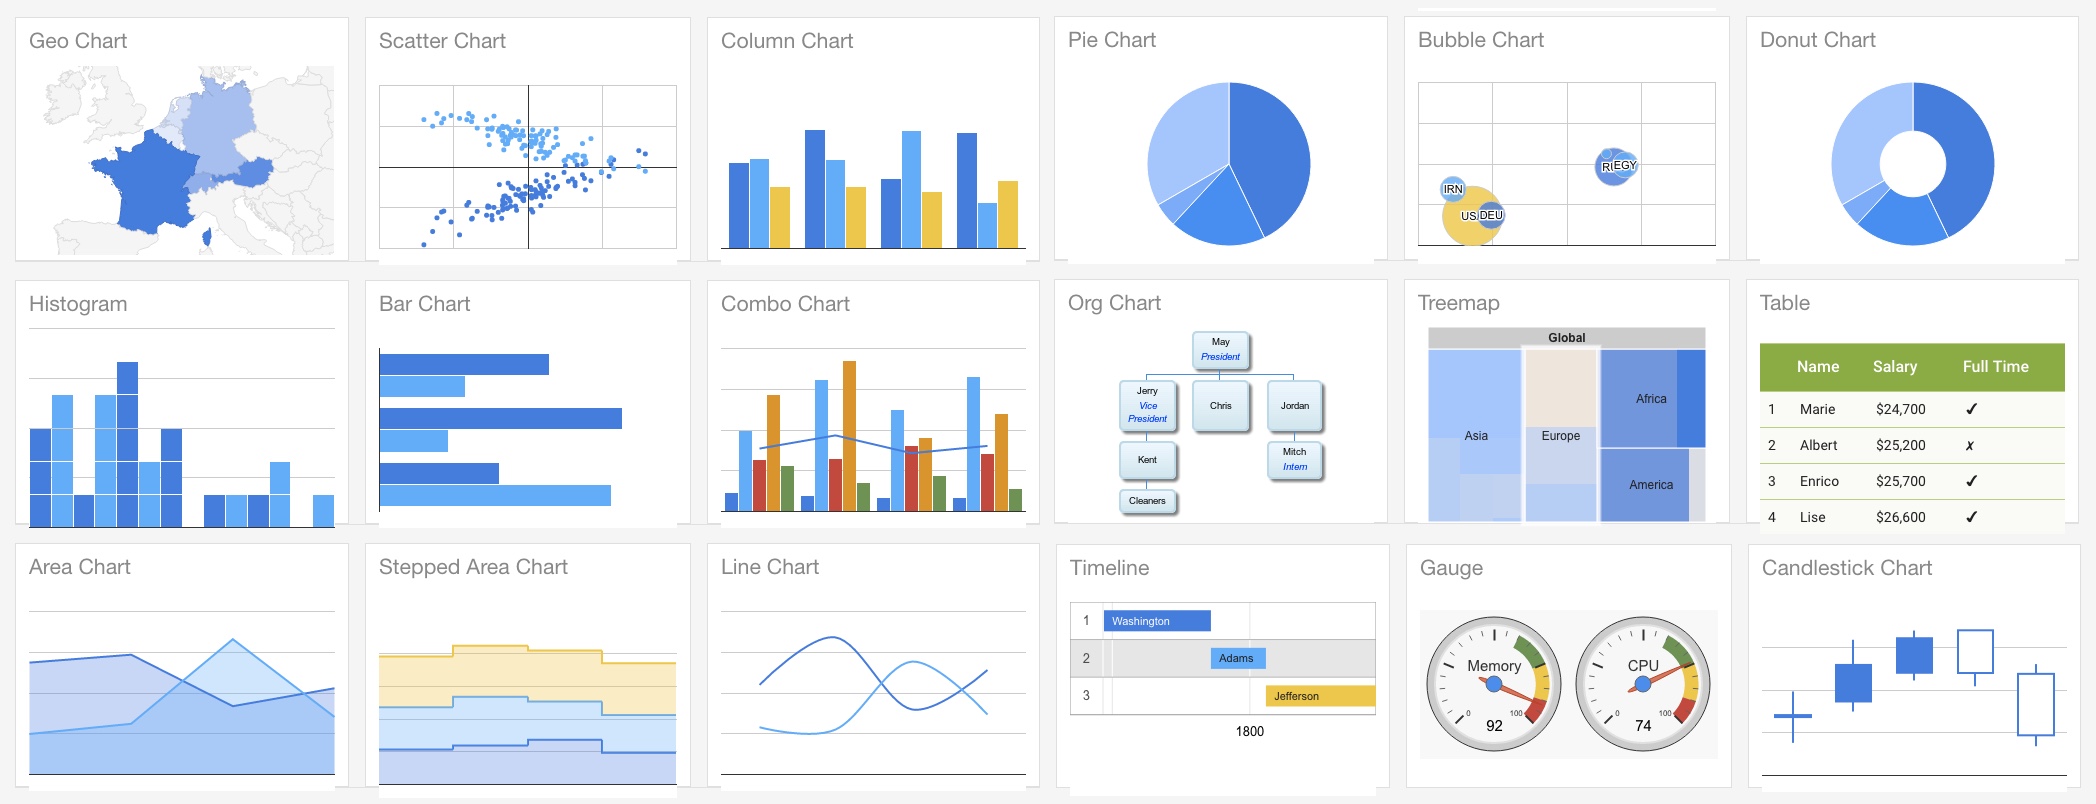
Google Charts is a great library to visualize your data: rich chart gallery, highly customizable, working across browsers and above of all, it is free.
Technology #
Google Charts are rendered using HTML5/SVG technology to provide cross-browser compatibility (including VML for older IE versions) and cross platform portability to iPhones, iPads, and Android. Your users will never have to mess with plugins or any software. If they have a web browser, they can see your charts.
PHP Google Charts #
Originally, Google Chart use javascript to create charts and graphs. However, we have made a great jobs to wrap Google Charts nicely with PHP class so that you can use Google Chart without bothering what are going on underneath. We also add capability to Google Charts so that it can work with data sources easily. As a result, creating a Google Column Chart from database could be simple like this:
<?php
ColumnChart::create(array(
    "dataSource"=>$this->src('mydb')->query("
        SELECT customerName, sum(amount)
        FROM orders
        GROUP BY customerName
    ")
));
?>
Namespace #
The namespace of Google Charts in KoolReport is \koolreport\widgets\google\. In order to use any chart you can start use the use statement to get reference to the chart you want to use like following:
<?php
use \koolreport\widgets\google\PieChart;
and then later you can use PieChart everywhere like this:
<?php
PieChart::create(array(
    ...
));
or you can use directly with the full class name:
<?php
\koolreport\widgets\google\PieChart::create(array(
    ...
))
Amazing!!! #
Google Chart in KoolReport not only works inside KoolReport's environment but anywhere.
Pure PHP Environment: Just create an index.php with following code
<?php
//index.php
require_once "koolreport\autoload.php";
use \koolreport\widgets\google\LineChart;

LineChart::create(array(
    "dataSource"=>array(
        array("Month,"sale"),
        array("Jan",8000),
        array("Feb",1200),
        array("Mar",9000),
        array("Apr",1500),
    )
));
With Laravel Framework: Inside view of Laravel
<?php
LineChart::create(array(
    "dataSource"=>DB::table("orders")->select('customerName','amount')->get()
));
Common Settings #
Any charts of Google has following settings:
| Name | type | default | description |
|---|---|---|---|
dataSoure | mixed | Set the source of data for widget, accept DataStore, DataSource, Process and even array, please see more details | |
columns | array | List of columns and its settings | |
width | string | "100%" | Width of chart in px or % |
height | string | "400px" | Height of chart in px or % |
title | string | Title of chart | |
colorScheme | array | List of colors applied to chart, for example: "colorScheme"=>array("#000","#444","#888") | |
options | array | This is the options for specific charts. It may vary from charts to charts so for more information, please look at example for specific chart below and its options. |
Client Events #
GoogleCharts support client-events so that you can do further on user's action on charts. Following are events that GoogleCharts supports:
itemSelect #
Trigger when an item on chart is selected for example the bar in BarChart or a pie in PieChart.
Example:
ColumnChart::create(array(
    ...
    "clientEvents"=>array(
        "itemSelect"=>"function(params){
            console.log(params.selectedValue);
        }",
    )
));
| Parameters | description |
|---|---|
selectedRowIndex | Index of selected row |
selectedColumnIndex | Index of selected column |
selectedValue | Selected value |
selectedRow | Selected row data |
columnName | Name of selected column |
table | Return the whole datatable of the chart |
rowSelect #
Trigger when a row on chart is selected, it is used in GeoChart widget
Example:
GeoChart::create(array(
    ...
    "clientEvents"=>array(
        "rowSelect"=>"function(params){
            console.log(params.selectedRow);
        }"
    )
));
| Parameters | description |
|---|---|
selectedRowIndex | Index of selected row |
selectedRow | Selected row data |
table | Return the whole datatable of the chart |
columnSelect #
Trigger when a column on chart is selected
Example:
LineChart::create(array(
    ...
    "clientEvents"=>array(
        "columnSelect"=>"function(params){
            console.log(params.columnName);
        }"
    )
));
| Parameters | description |
|---|---|
selectedColumnIndex | Index of selected column |
columnName | Name of selected column |
table | Return the whole datatable of the chart |
select #
Trigger on all selection on chart
Example:
ColumnChart::create(array(
    ...
    "clientEvents"=>array(
        "select"=>"function(params){
            console.log(params.selectedRowIndex);
        }",
    )
));
| Parameters | description |
|---|---|
selectedRowIndex | Index of selected row |
selectedColumnIndex | Index of selected column |
table | Return the whole datatable of the chart |
Get started with KoolReport
KoolReport will help you to construct good php data report by gathering your data from multiple sources, transforming them into valuable insights, and finally visualizing them in stunning charts and graphs.