Structure
Overview #
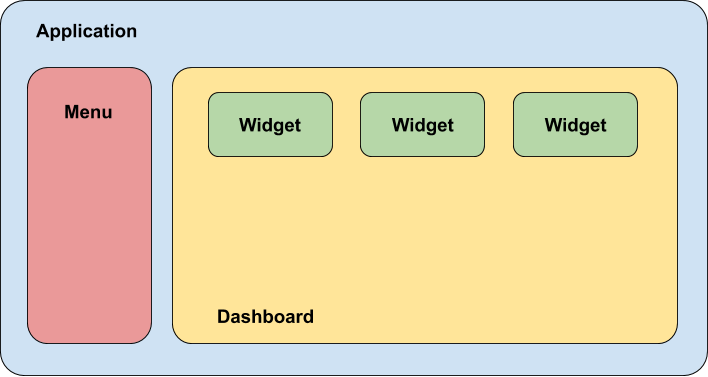
From top down, there are 3 main components of dashboard: Application, Dashboard and Widget. The Application contains many Dashboards and each Dashboard contains many Widgets. And all 3 main components are able to connect to database through DataSource.
Application #
The Application define common dashboard application settings:
- Pages listing
- Common menu system
- Authentication
- Permission
- Languages
- Themes
Click here to learn more about Application.
Page #
An application contains various pages, each page can have its own sub dashboards.
Click here to learn more about Page.
Dashboard #
The Dashboard is a set of information about single topic. It contains one or many widgets in form of charts or tables. For example, SaleDashboard contains sale metrics by month and a table of sale details.
Click here to learn more about Dashboard.
Widget #
Widget is the component inside a dashboard. Widget can work independently or cooperate with other widgets. Each widget has its own datasource and list of properties to define the way it behaves in dashboard.
There are several types of Widget:
- Displaying Widgets: Widgets that displaying information like Google Charts, Table.
- Input Widgets: Widgets that focus on interacting with users, acquiring inputs from user like Select, DateRangePicker
- Container Widgets: Widgets that help to layout for example Row, Panel, Tabs.
- Metric Widgets: Widgets that allows you to gain the business key indicators.
Click here to learn more about Widget.
DataSource #
DataSource as the name suggested will be the bridge between dashboard and database. We can make connection to following sources:
Get started with KoolReport
KoolReport will help you to construct good php data report by gathering your data from multiple sources, transforming them into valuable insights, and finally visualizing them in stunning charts and graphs.