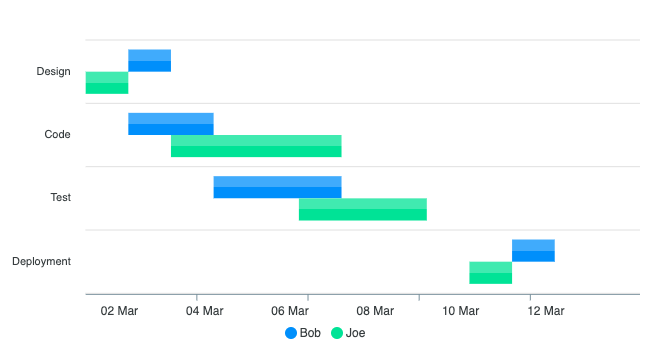
TimeLine Chart
Use a rangeBar Chart to describe start and end value in a bar/column chart.
Helpful in plotting a timeline of events when one needs to display start and end values.
Data Format #
The data format for rangeBar is slightly different than other charts. ApexCharts assumes that your data is in the 2-dimension vector [Start, End] format.
To create a multi-dimensional vector value, you can use a column's combination property as given in the below example:
$data = [
    [
        'phase',
        'timeline_start',
        'timeline_end',
    ],
    [
        "Analysis",
        "2019-02-27",
        "2019-03-04"
    ],
    [
        "Design",
        "2019/3/4",
        "2019/3/8"
    ],
    ...
];
\koolreport\apexcharts\TimeLineChart::create(array(
    "dataSource" => $data,
    "columns" => array(
        "phase" => [
            "label" => "Phase",
        ],
        'timeline' => [
            "label" => "Timeline",
            'combination' => [
                'timeline_start',
                'timeline_end',
            ]
        ],
    ),
Get started with KoolReport
KoolReport will help you to construct good php data report by gathering your data from multiple sources, transforming them into valuable insights, and finally visualizing them in stunning charts and graphs.