Synchronized charts
When you have multiple charts with a common x-axis and significant difference in y values, it’s a prevalent way to visualize it through synched charts.
In this Synchronized chart guide, we will go through the required setup to create such charts.
Setup individual charts #
Setting up the options for each chart. #
To show data in synch charts, just set columns[].charts to be an array of chart indexes (starting from 1) which are to show the column in:
    $data = [
        [
            "date",
            "sales1",
            "sales2",
            "sales3"
        ],
        [
            "2017-02-11",
            10,
            21,
            29
        ],
        [
            "2017-02-12",
            36,
            27,
            23
        ],
        ...
    ];
    \koolreport\apexcharts\SynchCharts::create(array(
        "dataSource" => $data,
        "columns" => array(
            "date" => [
                "label" => "Date",
                "categoryType" => "datetime",
            ],
            "sales1" => array(
                "chartType" => "line",
                "chartColor" => "#546E7A",
                "charts" => [1],
            ),
            "sales2" => array(
                "chartType" => "line",
                "chartColor" => "#008FFB",
                "charts" => [1, 2, 3],
            ),
            "sales3" => array(
                "chartType" => "area",
                "chartColor" => "#00E396",
                "charts" => [3],
            ),
        ),
        "options" => [
            "yaxis" => [
                "tickAmount" => 2
            ],
        ],
        "settings_1" => [
            "options" => [],
            // "showLegend" => true,
        ],
        "settings_2" => [
            "options" => [],
        ],
        "settings_3" => [
            "options" => [],
            // "showLegend" => true,
        ],
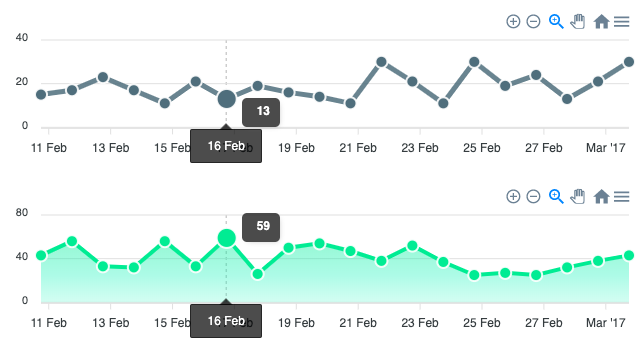
That’s it! Once you’re done, you’ll see 3 charts shown synchronously (two lines and an area) and when you hover over them or zoom in/out in one of the charts, you will see the other one follows.
Checkout the full example on Syncing Charts demo.
Get started with KoolReport
KoolReport will help you to construct good php data report by gathering your data from multiple sources, transforming them into valuable insights, and finally visualizing them in stunning charts and graphs.