February 13, 2019
We are very glad to let you know that we have released new version 3.25.3 of KoolReport. This version is our continuous effort to ensure the product quality and improvement. The update is completely backward compatible so you feel free to upgrade without worrying about your current works. Upgrade Now.

Enhancements
We have made a number of enhancements to the core. The first one is conversion of code base to comply with PSR Code Standard. This standard is accepted and adopted by wide range of developers all the world because it will help code look cleaner, easier to read and avoid potential code mistakes. Furthermore, by following this standard, our code base could be parsed by intellisense extensions in modern IDEs like Visual Studio Code or PHPStorm.
We have continued to improve the most used widget, Table. In previous version, we have new feature Row Grouping. In this version, we add more flexibility to Table's grouping template and style. We also add new sorting property to let you sort data on the table.
Google has updated the its charting library so we have update our Google Charts in KoolReport as well. If you use old version of KoolReport, it will not be possible to load multiple type of charts (coming from different chart packages). We have spent days to analyze the issues and make it work. If you have this issue, please upgrade to the newest version.
Bug fixes
We have fixed a big issue in Widget when we define data source by function. We also fixed the error related to grouping feature of Table when there is no data. We fixed the data duplication in KoolReport's run() methods. There are some other minor fixes as well that we could not list all here.
New package
The CloudExport is a new added package. The CloudExport will be a service hub to connect to online service provider to export your report to PDF, JPG, PNG or other formats. The package is totally free and available to download. The first cloud service that we implemented is ChromeHeadless.io. CloudExport will be alternative solution for Export package if you find difficulty to install PhantomJs or if you want to off-load the export function to cloud service and save your server's resources for other crucial tasks.
KoolReport Pro
KoolReport Pro 3.25.3 is also released together with new core. This release contains some new package releases: DataGrid 2.5.0, Excel 5.0.0, Inputs 4.5.0, Instant 3.5.0, DrillDown 3.0.0 and Pivot 4.3.0.
As you may aware, KoolReport Pro is yearly subscription based product. To add more flexibility in term of license, we added the Perpetual Usage badge which can be purchased together with KoolReport Pro license. This badge allows you to use KoolReport Pro forever even after subscription is expired. However it does not cover the Priority Support and Free Upgrade privilege.
In addition, we provide the Perpetual Usage, Support and Upgrade badge. If you purchased this badge together with your license, you will own the life-time usage for KoolReport Pro plus you will be entitled Life-Time Priority Support and Life-Time Upgrade privilege.
Summary
The KoolReport 3.25.3 is a must-upgraded version as it contains important enhancements and bug fixes. The update is backward compatible and you can upgrade without any changes to your current reports.
Enjoy!!
<3 koolreport team
December 14, 2018
KoolReport started as our internal project to standardize our report construction and growing to a strong framework for reporting. The strengths of KoolReport are its light-weight, speed, features extensibility and ability to integrate seamlessly into other PHP Frameworks.
We have put the first line of code in Jan 2017. Previously we have made thousand of reports for our customers. We saw the repeated tasks and common issues in making reports. That leads us to the thought of making a framework so that we could save time on repeated tasks and eliminate common issues.
Moreover, by having a standard framework for reports of all projects, we are able to manage code easier than before. Previously, each project followed different code patterns which make the took-over developer difficult to understand, fix code and develop further. But now, all reporting project follows the same pattern of code, the hand-over task become lesser and the documentation tasks are easier.
Take off
The KoolReport was first created solely for purpose of internal usage but we published it on GitHub and announced to KoolPHP users. Since then, we were very happy that KoolReport received very good feedbacks from thousand developers all over the world. Those are our great momentum to develop KoolReport further, adding more and more useful packages around it.
Until this time, we must say that KoolReport has become one of the top reporting framework or reporting tools. You may try to search google for “php report”, “php reporting tools” or “php reporting framework”, you may see us on top. That makes us very proud!
The concept of KoolReport is very simple, data is pulled from various data-sources, piped through series of processes then later saved to data store ready to be visualized. In the first phase, data connection, we provide PDODataSource as the main connectors to most common databases such as MySQL, SQL Server, Oracle etc. In the second phase. data processing, we provided over 30+ type of processes which you can use to transform your data. In the last phase, data visualization, Google Charts was chosen as our built-in charts library because of its power and the abundant of charts type.
KoolReport remains free and open-sources forever under MIT license which virtually does not bind you with any obligation when use KoolReport. You can download it, tweak it, use it, deliver it freely.
Around KoolReport core, we built a number of extended packages to extend its capability. A half of them are free for you use to just register and download. Some of them come with a tiny price, you consider the license purchasing as your donation to keep project going. We want KoolReport to go far so we need your help to fund the development and support.
KoolReport Pro
There is a special version of KoolReport called KoolReport Pro. This is an advanced version of KoolReport in which we combined KoolReport with all available extensions into single build. The compatibility between the core and extensions are guaranteed. We provide Developer License, Team License and Enterprise License for KoolReport Pro. Developer License is for individual who use KoolReport Pro to create reports for personal usage or for clients. Team License is for small team with max 5 developers. Enterprise License is for company which allows any developers within company can use KoolReport. Both of licenses comes with Priority Support and Free Upgrade privilege. Within a year, you will get support from our software engineer and data specialist to utilize the power of KoolReport Pro. And with the Free Upgrade privilege, you are free to download the latest library update with new features and new packages. Check out our KoolReport Pro if you are interested.
Get Started
To get started with KoolReport, please go ahead to our website koolreport.com and download the latest version of KoolReport. You may download, unzip and copy KoolReport folder into your web app or your can use Composer to install library. It is convenient in both ways.
We provide number of examples for you to start with. You may find the source code of all examples in the KoolReport & Examples version that you downloaded.
Remember to join our forum. There you can find all most all answers for your questions. If not, just simply create a new topic with your question, our support team will point you to the right direction. Or if you feel more convenient with Facebook, we have a group on Facebook that you can join and start discussing. Here is the group: KoolReport - The PHP Reporting Framework. Join us!
Resources
- Our website - Where all things begin.
- Forum - You may find all Q&A in here
- Examples & Demo - Over 100+ examples to demonstrate how KoolReport works
- Documentation - Documentation & API
- Blogs - This will keep you update of KoolReport releases, new packages, promotion & more.
- Github - You may clone or fork our project to play with it.
- Twitter - If you use Twitter, follow us to keep updated.
- Facebook Page - If you use Facebook, follow us to keep updated.
- Facebook Group - Keep update faster and interact with other members
Thank you very much and if you have any question, please let us know.
<3 koolreport team
November 16, 2018
LET PARTY to celebrate this amazing 3.0.0 version of KoolReport. There are many more improvements in this version than any versions released before. One of the greatest enhancements is the ability to add theme to your report and work seamlessly with other PHP Frameworks.

Stunning & stunning
We are often reminded that "Don't judge a book by its cover". Why's so? Is this because we tend to look at cover first to decide whether to read a book. In other words, the book with beautiful cover naturally catches our attention and more likely they will be read by us, won't it. The same with data report. Reading a data report will be less painful and more joyful if the report looks clean and beautiful. Koolreport may not help you to create interesting content (since it may depends on your creativity) but it surely will help you to create a beautiful one so that when look at it, people want to discover your report's content.
In this version, we would like to introduce the report theming capability. A theme when applied to your report will change the way widget rendering its contents together with color and even behaviors. As a result, your report will look very much better and will impress the viewers. You will love it, your boss will love it and your clients will love it.
We have released two basic themes Bootstrap 3 and Bootstrap 4 however more themes will come in near future. FYI, The reports in our new demos site uses theme called Amazing which will be available soon!
class MyReport extends \koolreport\KoolReport
{
    use \koolreport\amazing\Theme;
}
Seamless integration
We understand that nowadays barely is an PHP application built without a framework. From the beginning, we designed KoolReport to work inside any PHP Frameworks like Laravel, CodeIgniter or Symfony. In this version, the integration of KoolReport into other frameworks goes to new level in which you may even use KoolReport's widgets inside those frameworks without initiating a report.
For example, you may create ColumnChart in Laravel's view file simply like this:
<?php ColumnChart::create(array(
    "dataSource" => DB::table('orders')
                    ->select('department', DB::raw('SUM(price) as total_sales'))
                    ->groupBy('department')
                    ->havingRaw('SUM(price) > ?', [2500])
                    ->get()
));?>
Do you see that ColumnChart widget is able to receive Collection of Laravel Framework and use it as its data source. Also, the widget does not need any further settings to be rendered on Laravel's environment. KoolReport's widgets are able to work in CodeIgniter and other framework in the same ways. More information!
Release Notes
There are much more to say about this release but we only are able to highlight the most interesting parts here. If you are interested on more details, please read our KoolReport Version 3.0.0 Release Notes.
New Examples and Documentation
We have created a new look for our Examples and Demos. Not only new look is implemented but also 70+ more examples have been added for you to get started with.
Together with new examples, we have also upgraded our Documentation as well. We have been working very hard to write every details of the framework so that you can understand it deeper and use it better.
Enjoy & Have A Great Day!
<3 koolreport team
August 9, 2018
Data storytelling will be a new exciting field in which science and art merge. And data become truly valuable only when they can drive our actions toward changes for better.
After your business has started collecting and gathering data from all sources, the next difficult step is to dig into those data and get the potential value of them. Your collected data is like a gold mine hidden deep down beneath the earth. The data analyst is like a gold miner digging into data to find valuable insights. But those insights can only become truly valuable if they can turn into actions or changes in your business. If those insights is not understood or does not look appealing to people, they are nothing more than pieces of metal. Google’s Chief Economist Dr. Hal R.Varian stated, "The ability to take data—to be able to understand it, to process it, to extract value from it, to visualize it, to communicate it—that’s going to be a hugely important skill in the next decades."
As data becomes increasingly ubiquitous, we have witnessed the hot trends of the jobs of data analysis and mining. LinkedIn recently reported that data analysis is consistently one of top 4 wanted skills in job description. But interestingly the last skill of transforming those data insights into actions is in less required although those top data analyst with advanced degrees in mathematics, economics, statistics struggle to communicate their insights to others effectively. Our ultimate goal is the change, we are getting close but still not reaching yet.
The demand of data storytelling skill will increase in the future. With the availability of self-service data tools, more and more people will be able to access the data insight by their own. As a result, more and more insights will be generated like never before. However, unless we enhanced the communication for those insights, we only see lower and lower conversion rate from insight-to-value. If people see those insight not appealing enough, change will never occurs. Data mean nothing!
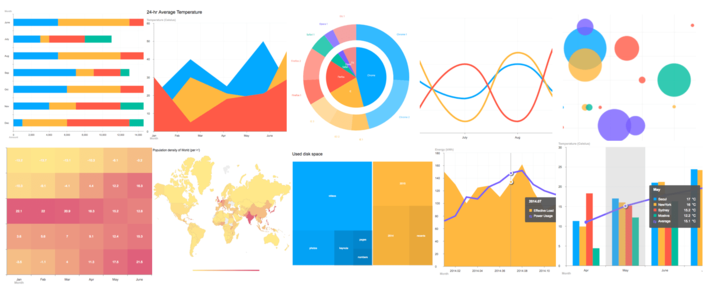
Data Storytelling is a new term. Hearing the term, people normally think about the data visualization, info-graphics, dashboard, data presentation. Too often, people understand storytelling is just beautiful and clear charts and graphs. The truth is that data storytelling is a structured approach to communicate those insights, it involves combinations of three elements: data, visuals and narrative.
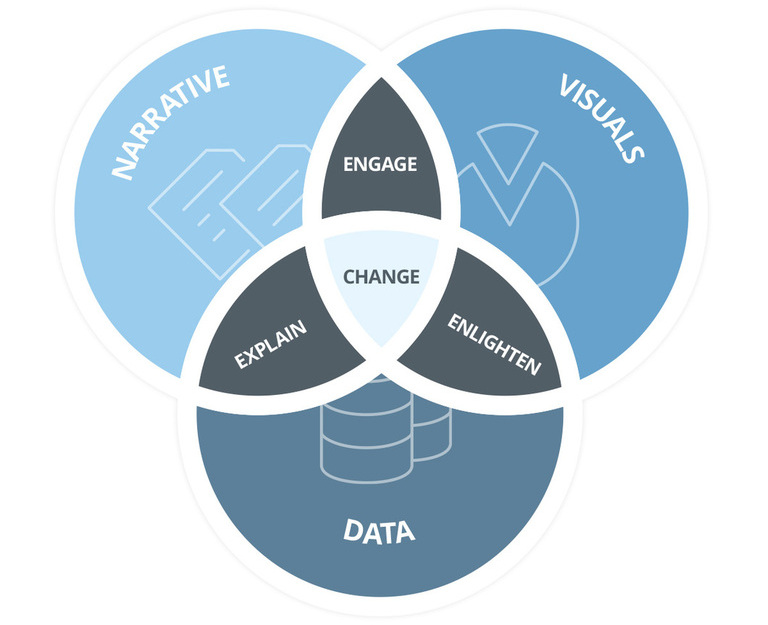
When we have data and narrative going along, we are explaining to our audience what is happening and maybe why. When data is coupled with visuals, we are enlightening the understanding of data. Seeing charts and graphs, we have have better feel of the trend. When visuals is applied to narratives, we are engaging our audience to the story. The effect is like we watch a good Hollywood movie. And with the combination of all three elements: data, visuals and narratives, we will explain, enlighten and engage our audiences. And by those actions, we may have the chance to drive our audiences to actions. That’s our ultimate goal.
The importance of data storytelling
Story has been going with us through the history. Our ancestors told us story of heros, our country emergence. Those story are passed from generation to generation and will be continued.
Today modern storytelling may be associated with TED for example and the analysis of the most 500 popular TED talks shows that storytelling made of 65% of their content. So we can see that storytelling is an effective way to convey ideas, thoughts and insights in the way that memorable, persuasive and engaging.
According to study, human decisions are often attached to emotion not logic. How many times we buy a thing because we want it and not because we need it? We buy a new phone to replace the last year model which is still working very well. So things that touch our emotion are the ones lead us to action. The data insights represented in numbers or charts and graphs touch us mostly in the logic layers but story touches us deeper in our emotion layers. That is the reason why story is much more effective in driving our actions by its power of memorability, persuasiveness and engagement.
Memorable: A study by Stanford professor Chip Heath (Made to Stick author) found 63% could remember stories, but only 5% could remember a single statistic. While 2.5 statistics were used on average in the exercise and only 10% of the participants incorporated a story, the stories are what caught people’s attention.
Persuasiveness: In another study, researchers tested two variations of a brochure for the Save the Children charity organization. The story-based version outperformed the info-graphic version by $2.38 to $1.14 in terms of per participant donations. Various statistics on the plight of African children were far less persuasive than the story of Rokia, a seven-year-old from Mali, Africa.
Engagement: Researchers also discovered people enter into a trance-like state, where they drop their intellectual guard and are less critical and skeptical. Rather than nitpicking over the details, the audience wants to see where the story leads them. As mathematician John Allen Paulos observed, “In listening to stories we tend to suspend disbelief in order to be entertained, whereas in evaluating statistics we generally have an opposite inclination to suspend belief in order not to be beguiled.”
Conclusion
Many great insights could be never be a gold if they are not fueled by a convincing story. Data storytelling will be a new exciting field in which science and art merge. And data become truly valuable only when they can drive our actions toward changes for better.
<3 koolreport team
July 18, 2018
To celebrate the release of new version, we would like to offer 15% DISCOUNT For All KoolReport Pro Licenses. The promotion starts today and will last for a week until 26th July, 2018. Seize the chance!
KoolReport Pro
KoolReport Pro is an advanced solution to make data report or dynamic dashboard in PHP. Building on top of the core, KoolReport Pro is powered by various extended packages that make it features rich, capable of handling almost all reporting tasks such as data processing, data analysis, visualization, exporting and more.
Let Your Data Speak
Data visualization is one of the most important factors to make a successful report. Intuitive charts or graphs will let your data communicate. KoolReport Pro provides you many chart types to choose, from the basic ones like PieChart, BarChart, LineChart to the advanced ones like GeoChart, Histogram, GranttChart and more. Those charts are from the best chart libraries in the world which we can name some such as Google Charts, ChartJS or Morris, all are unified in the same settings so you can switch between them in a flash of second.
Data Processing Power
KoolReport Pro is able to deal with your complex data and ultimately turn them into useful information. You need to summarize data in pivot table? Need calculate statistics or perform regression? All can be done with KoolReport Pro.
Simple, Fast and Extensible
Designed to be simple and easy to use, KoolReport only take you 10 minutes to install the framework and create the first report. It is very fast and able to handle large amount of data. Furthermore with plug-and-play structures, KoolReport is designed with high stress on ability to scale and extend functionality.
Work Seamlessly With Other Frameworks
“If you want to go quickly, go alone. If you want to go far, go together.”
We want KoolReport to go far so we designed it since the beginning to work well with its big framework brothers such as Laravel, CodeIgniter, Symfony and others.
Why Should I Get KoolReport Pro?
Beside all great features of KoolReport Pro, you also get the following:
- Full Source Code for customization
- One(1) year of Priority Support from data and software experts
- One(1) year of Free Upgrade
- One(1) year to get new commercial packages free
- Right to distribute to unlimited clients
- 50% OFF when renewing license
- Fully refund if things go wrong
Thank you very much and if you have any questions, feel free to reach us at support@koolreport.com.
<3 koolreport team