October 8, 2019
We would like to inform that we have released new version KoolReport 4.3.0 ready for your upgrade. This is a worth upgrading version containing many improvements and important bug fixes.

Details
For further details of the changes in this new version, please follow these links:
This upgrade is backward compatible so feel free to upgrade now!
Some more good news
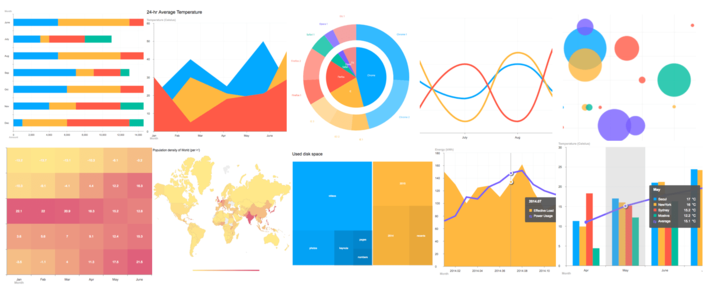
On further update, we have released a new chart package called D3. The package is built on top of D3JS (Data-Driven Documents) to provide visualization strength for KoolReport. D3JS is very famous Javascript library which is behind many beautiful charts and graphs. Except for the most common charts like Line or Pie, we have added Waterfall and FunnelChart to extend choices for your data visualization. IT IS JUST THE BEGINNING! More and more stunning charts will be added to D3 package.
KoolReport Pro 4.3.1 has been released as well with new core and the upgrades of 14 packages including Pivot, DataGrid, Export and more.. If you have KoolReport Pro license, you may upgrade now via manual download or composer installation. If you have not owned a license yet, please consider to get one now. You will love it!
P.S: KoolReport team wish you have a great day and do not forget to support us. We are and will work hard to bring you to best product saving you time & effort. That's our promise.
<koolreport team
December 14, 2018
KoolReport started as our internal project to standardize our report construction and growing to a strong framework for reporting. The strengths of KoolReport are its light-weight, speed, features extensibility and ability to integrate seamlessly into other PHP Frameworks.
We have put the first line of code in Jan 2017. Previously we have made thousand of reports for our customers. We saw the repeated tasks and common issues in making reports. That leads us to the thought of making a framework so that we could save time on repeated tasks and eliminate common issues.
Moreover, by having a standard framework for reports of all projects, we are able to manage code easier than before. Previously, each project followed different code patterns which make the took-over developer difficult to understand, fix code and develop further. But now, all reporting project follows the same pattern of code, the hand-over task become lesser and the documentation tasks are easier.
Take off
The KoolReport was first created solely for purpose of internal usage but we published it on GitHub and announced to KoolPHP users. Since then, we were very happy that KoolReport received very good feedbacks from thousand developers all over the world. Those are our great momentum to develop KoolReport further, adding more and more useful packages around it.
Until this time, we must say that KoolReport has become one of the top reporting framework or reporting tools. You may try to search google for “php report”, “php reporting tools” or “php reporting framework”, you may see us on top. That makes us very proud!
The concept of KoolReport is very simple, data is pulled from various data-sources, piped through series of processes then later saved to data store ready to be visualized. In the first phase, data connection, we provide PDODataSource as the main connectors to most common databases such as MySQL, SQL Server, Oracle etc. In the second phase. data processing, we provided over 30+ type of processes which you can use to transform your data. In the last phase, data visualization, Google Charts was chosen as our built-in charts library because of its power and the abundant of charts type.
KoolReport remains free and open-sources forever under MIT license which virtually does not bind you with any obligation when use KoolReport. You can download it, tweak it, use it, deliver it freely.
Around KoolReport core, we built a number of extended packages to extend its capability. A half of them are free for you use to just register and download. Some of them come with a tiny price, you consider the license purchasing as your donation to keep project going. We want KoolReport to go far so we need your help to fund the development and support.
KoolReport Pro
There is a special version of KoolReport called KoolReport Pro. This is an advanced version of KoolReport in which we combined KoolReport with all available extensions into single build. The compatibility between the core and extensions are guaranteed. We provide Developer License, Team License and Enterprise License for KoolReport Pro. Developer License is for individual who use KoolReport Pro to create reports for personal usage or for clients. Team License is for small team with max 5 developers. Enterprise License is for company which allows any developers within company can use KoolReport. Both of licenses comes with Priority Support and Free Upgrade privilege. Within a year, you will get support from our software engineer and data specialist to utilize the power of KoolReport Pro. And with the Free Upgrade privilege, you are free to download the latest library update with new features and new packages. Check out our KoolReport Pro if you are interested.
Get Started
To get started with KoolReport, please go ahead to our website koolreport.com and download the latest version of KoolReport. You may download, unzip and copy KoolReport folder into your web app or your can use Composer to install library. It is convenient in both ways.
We provide number of examples for you to start with. You may find the source code of all examples in the KoolReport & Examples version that you downloaded.
Remember to join our forum. There you can find all most all answers for your questions. If not, just simply create a new topic with your question, our support team will point you to the right direction. Or if you feel more convenient with Facebook, we have a group on Facebook that you can join and start discussing. Here is the group: KoolReport - The PHP Reporting Framework. Join us!
Resources
- Our website - Where all things begin.
- Forum - You may find all Q&A in here
- Examples & Demo - Over 100+ examples to demonstrate how KoolReport works
- Documentation - Documentation & API
- Blogs - This will keep you update of KoolReport releases, new packages, promotion & more.
- Github - You may clone or fork our project to play with it.
- Twitter - If you use Twitter, follow us to keep updated.
- Facebook Page - If you use Facebook, follow us to keep updated.
- Facebook Group - Keep update faster and interact with other members
Thank you very much and if you have any question, please let us know.
<3 koolreport team
February 8, 2018
Business analytics is a method of diving in organization's data, using statistical analysis to explore the hidden information in the data. The ultimate goal of business analytics is to enhance the view of business and to support decision making process.

In those recent years, the term data-driven business has been emerged to indicate those companies treat their data as an assets and utilize it as the important competitive advantages. Sale and marketing, customer relation management are frontier areas that those companies aiming at. The business are transforming with data-back decision making. It is the trend, unavoidable trends that those who do not utilize will be left behind.
There are three (3) types of business analytics:
Descriptive analytics (Business Intelligence)
Descriptive analytics is normally used to track the performance of a business. It answers the question of how good is the state of business within specific timeframe. It answer the question of
- What happens in business?
- Who involved?
- When?
- Size of effects?
There are boom of tools for this kind of descriptive analytics that we can name some such as Microsoft Power BI, Tableau and Qlik. Those tools will help organization to get insight view of current state of business, setting up the business alert through threshold, real-time report and so on. The tools are even made easier so that people with little knowledge of data science can access and use. There are no need of data analyst, although better to have, to use the tools.
Predictive analytics
If descriptive analytics is the basic of business analytics, the predictive analytics is advanced one. It use the data to sketch out the trends and predict the future outcomes. This is difficult area and normally required data expert in an organization. The work involves so much in building predictive model which can be simple as linear regression or complex as neural network AI.
Prescriptive analytics
This is the highest level of business analytics in which the past business performance will be used to create recommendations to handle similar situations in the future. It can help to answer questions of
- Why did it happens?
- Will it happens again?
- What will happens if we change X?
- What else data tell us what we never thought to ask?
Do not confuse this with predictive analytics since predictive analytics may show us the trends, the possible outcomes but it does not tell us why. On the other hands, the prescriptive does. Predictive analytics know what will happens but prescriptive analytics know why it happens. It can simulate the situation when some variables change. This advance will provide the management level in an organization the ability to browse through the options and know what will happen. Furthermore, it can tell us things we are not aware of. It kills the business risk of being unaware of unknown problems.
Business Analytics is wide area and the it will change business profoundly. The recent technology such as big data, cloud computing, deep learning makes us to get close to business analytics ever.
Some questions related to KoolReport
Where is KoolReport now in this big picture?
KoolReport now is early stage of business analytics. Specifically, it is in the state of descriptive analytics (business intelligence), the lowest level. It helps to unite data from different sources, process and summarize it then visualize it in meaningful way. It is suitable for creating report (KPI. metrics), online dashboard (the summarization of current state of business), OLAP(pivot, cube, slice, drilling report).
It is like a baby need to learn crawling before he/she can walk. We believe that doing well in this stage will be a foundation for us to move to the next.
Where KoolReport is heading to?
Of course, we want to move up step by step to the latest level of business analytics.
Why are you confident?
KoolReport is built as open-source framework for reporting. Why? Because it will be open to any contribution of third party. Everyone can build extended packages to process data. The hidden power of KoolReport is lying in its lego structure in which extended package can be used in plug and play manner. KoolReport hopes to be the hub to connect business who need data processing solution and third party who can provide it. In general, we aim at creating a market for it. And by this way, KoolReport will have chance to move up step by step from lowest level of business analytics to the highest one.