October 19, 2022
We are happy to announce that big release for KoolReport products have been available. This release contains many improvements to the library and it worths your upgrade.
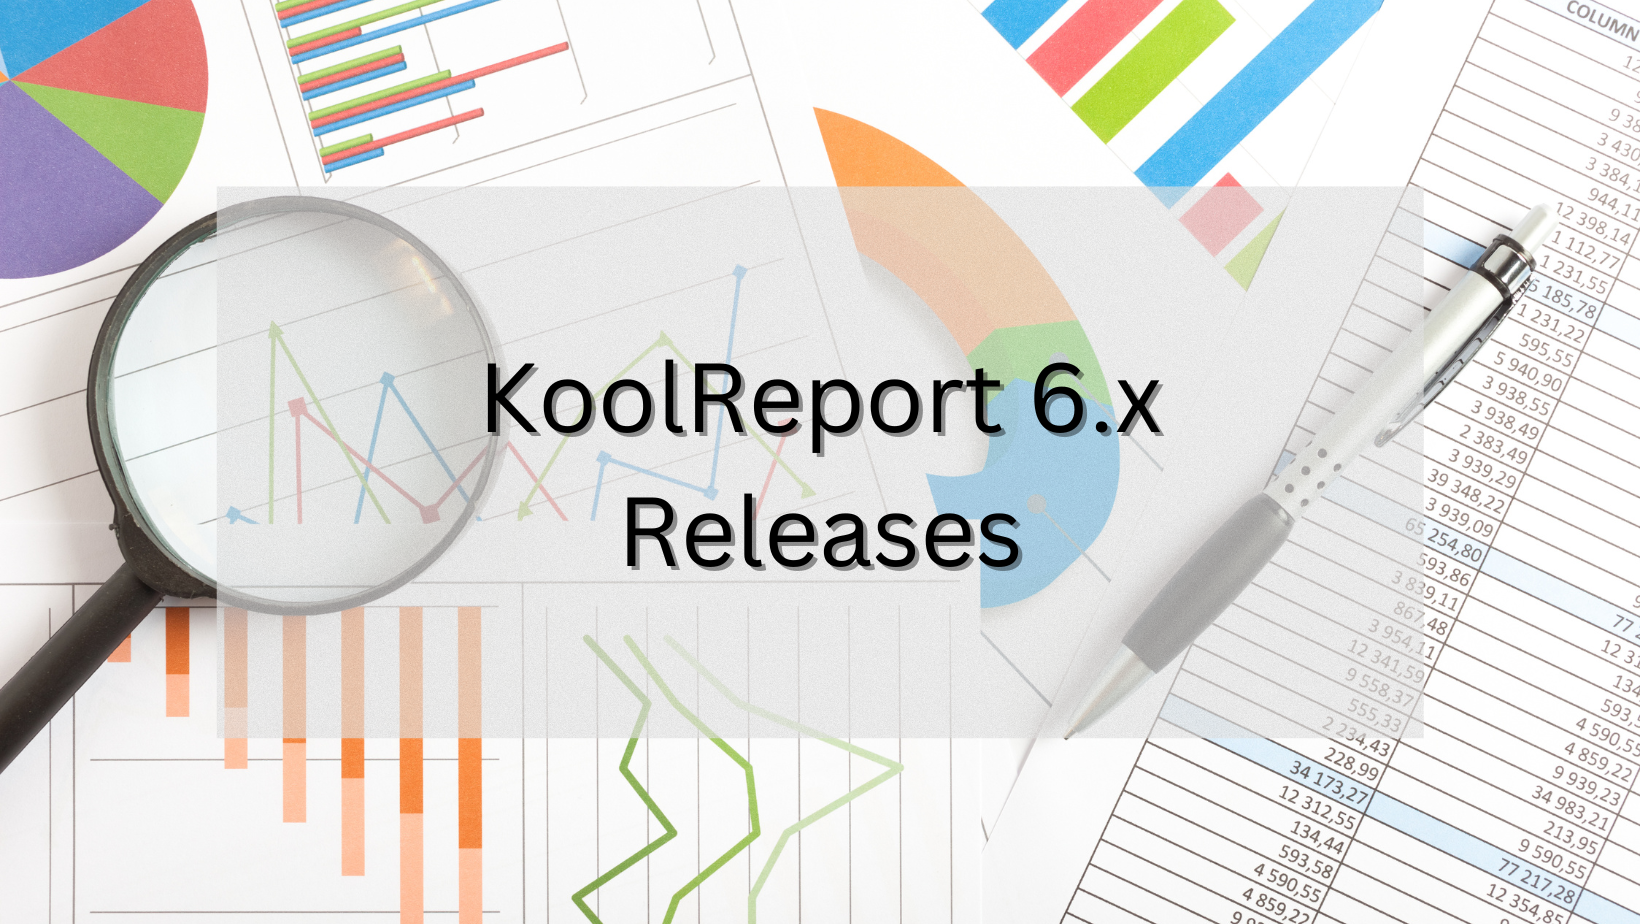
Core 6.x
KoolReport Core has been improved its datasources for better connection. The library was also equipped with optional PHP generator mechanism to reserve resources to handle large data report. In previous version of KoolReport, we may experience some notices when working with PHP 8.x but now all are gone.
KoolReport Pro and its packages
Together with release of the core, KoolReport Pro also reached version 6.x with the upgrades of many packages:
- Amazing 2.1.3: Handle dashboard framework theme
- Inputs 6.2.0: Upgrade client library and fix bugs
- QueryBuilder 3.3.0: Fixed issue in from() methods
- ChartJs 3.2.0: Ability to handle chart's onClick events and able to use inline plugins.
- Charttable 1.3.0: Ability to transpose table with flexible column names
- Cube 3.5.0: New methods like count distinct, count not null and sum distinct.
- Datagrid 7.7.0: Smart searching mode, complex header labeling.
- Excel 10.5.1: Fixed bugs, adding footer with aggregating methods
- Pivot 9.0.1: New methods like count distinct, count not null, new computations property for Pivot2D
New AppStack theme
Beside existing Amazing theme, we have provided a new theme called AppStack. The theme has been added into KoolReport Pro that you can try out now.
Dashboard Framework 4.x
This new version of Dashboard Framework contains so many improvements that you should upgrade:
- Dynamic themes: The theme now can be set during runtime, it opens the possibility for users choose the theme that they like.
- Dynamic languages: Able to let user choose their preferred languages
- Multi pages: Can have more than one page with different menu system.
- FlexView: A new widget of Dashboard that can hold and show different views.
- InlineEditAction: New action for admin panel that allows resource be edited right on table
- Compability: Working with latest PHP 8.x version.
Read our Dashboard 3.5 to 4.x upgrade notes.
Thank you very much!
<3 koolreport team
December 25, 2021
Reporting section is always a part of any system, sometimes it plays a crucial part. We have learnt this through hundreds of projects we did for our customers. So what is KoolReport and why you should consider having it in your great php application.
What is KoolReport?
By definition, KoolReport is an intuitive and flexible open-source PHP Reporting Framework for faster and easier data report delivery. Just like any php framework like Laravel or CodeIgniter, KoolReport provides developers a frame to code, a list of ready-made functionalities to build things. While other frameworks focus on constructing web applications, KoolReport only focuses on one thing: using PHP to construct great data reports.
Koolreport was born from the fact that data reports appear very often in almost all web applications. It is understandable because we always need to know the status of applications such as number of visitors, number of registered users or number of item sales and so on. We have built several hundred applications for our customers and 90% have report sections. In some of them, the report section is actually the main part. This is the biggest motivation for us to construct KoolReport in the first place.
There are 5 reasons that you would like to have KoolReport in your projects:
Easy
Easy to install and easy to use. You can install KoolReport by either downloading a copy and putting it inside your application or by using composer with a single command line. The structure of a report is very simple, one php class for report’s definition and one view file for report’s visualization. That’s why you can start using KoolReport in almost no-time.
Single purpose
KoolReport only does one thing and only one thing: building a good data report. Nothing more. You will not see routing, authentication or whatsoever. Is it bad? It depends on each opinion but for us, doing one thing best is better. “Make a good report” is not a simple task in fact. It includes 3 things.
First is the ability to connect to various sources and bring in data in one place. A report could be combined results from different data sources, a little from MySQL, some in Postgresql and other from CSV.
Second is the power of data processing. Data is gathered but how to fastly combine and transform them into meaningful information is the question. KoolReport contains over 30 built-in data processes which you can use with your data.
Last is data visualization capability. We have all meaningful data but without a good representation, the story could not be told. KoolReport is integrated with rich charts and graphs that come from well known libraries such as Google Chart, D3 or ChartJs for you to convey your data in the most impressive and interactive way.
Work with different environments
KoolReport can be integrated into Laravel or CodeIgniter or any MVC frameworks out and utilize their functionalities not existing in KoolReport. So KoolReport wants to be part of ecosystems, does one good thing and corporate with others, all heading to a final purpose: A great application.
Inherit experience of data report maker
Our deep experience of making data reports has been put into KoolReport. Moreover, the comments, recommendations and error report from users helps us to perfect KoolReport through many years. So using KoolReport, you are using a proven framework made by experts and growing from real use cases.
Free and open-source
Cost is always a part of the decision as always. KoolReport is released as a free and open-source library under MIT license which virtually gives you full right to use, to access and modify source-code as your own need.
So above are the top 5 reasons that you should use KoolReport inside your project. Of course, any solution has drawbacks and KoolReport will not be an exception. The reasons we give could be biased and the best way is your own experience with the framework.
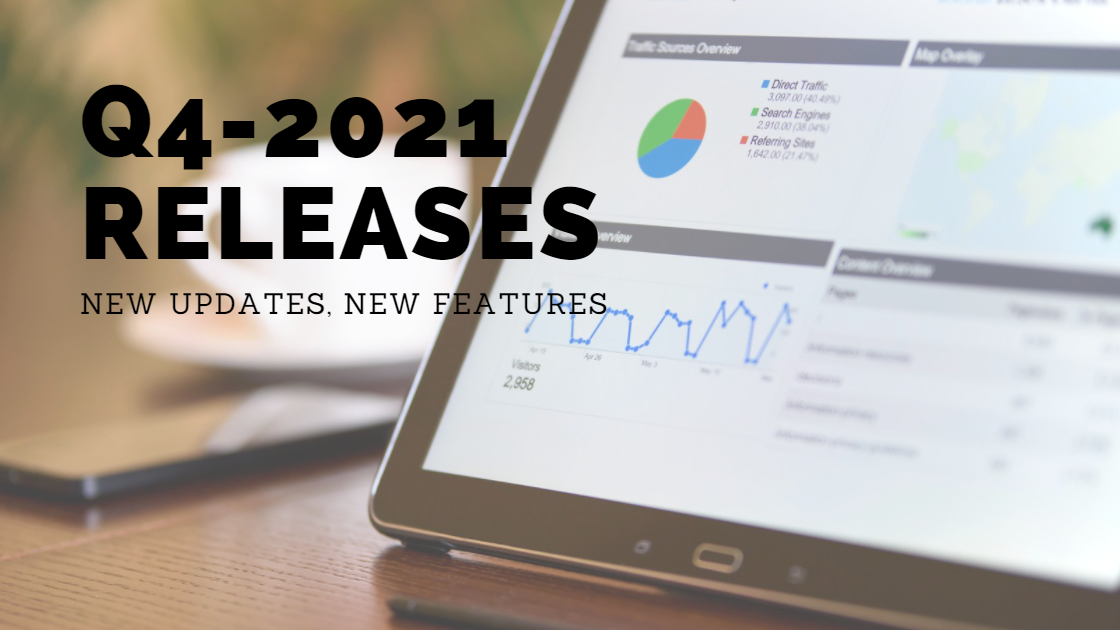
November 17, 2021
We are very happy to inform that the Q4-2021 releases have been available. In this releases, we have a new core KoolReport together with 12 new package updates. We will go through each packages' update and note that the biggest change will be at the end.
Core 5.5.0
KoolReport core 5.5.0 has been releases with ability to use PDODataSource to update/delete data with execute() method. This extent comes from the demand of not just fetching data but also updating database. We added new process called Forward which basically act as a forwarder to branch data with conditions. There also a small update to Google Chart in which the chart can accept more than one annotation text. The last update comes from Table in which we make the removeDuplicate property work with both column names and column orders.
ChartJS 3.0.0
In Chartjs 3.0.0 we introduce Timeline chart which is very useful for representing multiple events' time range. Another big update is multiple axes support. Now users can add multiple Y value axes for multiple data series.
Charttable 1.2.0
With Charttable 1.2.0 we fix a common bug with "columns" property to make Charttable behave similarly to Table or DataTables widget.
CloudExport 4.0.0
In CloudExport 4.0.0, we update the underlying chromeheadlessio/php-client package to prepare support for a near future release of a local cloud export server running in Docker.
DataGrid 7.0.0
Popular DataTables's version 7.0.0 has a new property called rowspan (aliases: removeDuplicate, groupCellsInColumns) which groups/merges verticaly adjacent cells with the same value. It is somewhat similar to row group but has a different visual format which many users like. Many client side functions for expanding/collapsing/toggling row groups, row details are implemented as well. Option for setting a custom ajax url when using server side processing is added as ajaxUrl property.
Excel 9.0.0
A new excel widget, Pivotmatrix, is added in Excel 9.0.0 besides various fixes. PivotMatrix is nearly similar to PivotTable except for a slightly different and improved excel layout.
Export 5.1.0
Export 5.1.0 introduces a serverLocalAddress option in case a report server can not access its report resources (js/css/images/fonts/etc) via its domain name and must use a local address like "localhost" or "127.0.0.1".
Morris 3.0.0
In Morris chart 3.0.0, we present strong customization server-side options for hover and format templates.
Pivot 8.1.0
Pivot 8.1.0 brings solid fixes like aggregates' auto meta data, a property name typo (impressively, we know) to an already full-featured package.
Inputs 6.0.0
The DateRanngPicker and DateTimePicker have been fixed a big bug related to calculating this month timeframe. The CheckBoxList and RadioList also are improved with changing bootstrap.
QueryBuilder 3.1.0
QueryBuilder is working just great, only received a small bug fix in generating delete query which happens in very rare case. Thanks to our beloved customer Michael to spot this issue.
Dashboard 3.0.0
Stepping from version 2.0.0 to 3.0.0, Dashboard has been put under a huge operation with many improvements and bug fixes. There were about 50 changes recorded in our changelog for version 3.0.0.
The biggest feature in Dashboard is the Admin Panel. With this feature, you can construct a beautiful admin panel to administer your data, your application operation or even your business. Writing only few lines of code, you can implement a full CRUD system to admin your resources. But it does not stop there, CRUD is just a basic feature of it. Admin Panel is very flexible that allows you to define your own list of glasses to view your data in different angles, to construct your own data filtering and to build your own actions on each piece of your data. Building on top of powerful KoolReport Pro and Dashboard Framework, Admin Panel is the best of both worlds: A powerful admin panel and an advanced KPI dashboard system. And not to forget, Admin Panel is developed as a part of Dashboard Framework so if you have Dashboard Framework license, you have Admin Panel features available NOW.
View Dashboard & AdminPanel's Demo
The Dashboard Framework now has a new notification system. In every actions of Dashboard or Widget, you can return an notification object like Alert, Confirm, Note or even a raw javascript code to be executed at client-side.
In this new version, we have provided the Excel and CSV exporting capability as our promise to you from the last version.
It is hard to list all changes here, for details you can have a look at our Dashboard's changelog.
Although we incorporated many new features into Dashboard Framework, we maintained a solid backward compatibility so you feel free to upgrade to new Dashboard 3.0.0.
Our road map
Despite of the Covid-19 epidemic crisis, our team have successfully managed our constant releases to make sure that bugs are fixed, new features are available, support requests are solved. Our next plans & products for 2022 will be:
- Continue improving KoolReport and its packages
- Perfect the Dashboard Framework: new capabilities, new themes .etc
- Construct Dashboard Builder, a drag and drop GUI to construct dashboard & admin panel.
- Dockerize our Chromeheadlessio service to provide on-premise PDF generator solution.
- Provide off-the-shelf OLAP solution.
Thank you very much!
<3 koolreport team
August 27, 2021
Welcome to KoolReport's rumor channel. Today I will tell your some secrets about their products that you may not know.

First: KoolReport Core 5.1.0 was released
The new version 5.1.0 was released with improvements such as better datasource functionality, PHP8 compatibility together with some minor bug fixes. It is actually not a rumor, I just took the information from their change log.
Second: Many packages got updated
I heard that together with new version of KoolReport Core, many packages got updated:
- Amazing 1.7.0: Fix browser console warning
- BarCode 2.1.0: Able to save barcode to file
- CloudExport 3.0.1: Able to looking for resource link within CSS file
- ChartTable 1.1.0: Remove the resource-dependency of ChartTable on other packages so that it can work alone
- ChartJs 2.5.1: Smoother plugins integration
- D3 1.6.0: Working better at client-side
- DataGrid 6.0.0: Great enhancements for clientRowGroup and server-side searching functionality
- DrillDown 3.5.0: Ability to set global scope variables
- Excel 8.5.0: Adding "removeDuplicate" feature to Table and fix issue of number formatting in Excel
- Pivot 8.0.0: Add ability to initiate silently and shown on-demand.
- Query Builder 3.0.0: Now able to generate call procedure
- VisualQuery 2.0.0: A complete makeover from version 1.0
The above upgrades of the core and packages make the new KoolReport Pro 5.7.0. They maintain strong backward compatibility so we can feel free to upgrade to latest version.
Third: A new and more powerful Dashboard Framework 2.0.0
I also heard the Dashboard Framework has gone through a BIG surgery from version 1.0.0 to much more powerful v2.0.0 with more than 50 changes. Its best new features are:
- Extend datasource connection to SQLite and Oracle
- Improve debugMode to show unexpected error
- Adding Logging system that able to report issue via multiple channels
- Improve Metrics behaviors
- Integrate full text search into Dashboard table
- Bring new widgets on board: DrillDown, PivotTable, D3 and ChartJs
- Ability to call procedure from datasource
- Incorporate DetailView into widget and let user view data behind any charts
- Increase the flexibility in settings property with anonymous function
- Able to export dashboard or widgets to PDF
Beside, I heard the next version of Dashboard will have a big feature to help us manage our application's database. The name of it was not yet confirmed BUT it is promised to be the most flexible built-in CRUD+. Despite of all improvements took or will take place, someone told me that the price of Dashboard Framework will not change whatsoever. Can you believe it?
Alright, that's all for the rumors!
Have a great day and looking forward to seeing you in the next episode.
<3 koolreport team
January 13, 2021
It should be fun and easy to build. In KooPHP inc, we always keep in mind one thing "Developer must be happy!" because only when happy, he can build the whole world.

It sounds a bit exaggerated but it is true that if we want to build something bigger, we need to free our mind from hassle and focus strongly on main things.
Building a dashboard is not an exception. While what we should focus on is the content of dashboard such as "how data is available and organized?" "what chart types should be used to maximize user's understanding of data?", those tedious tasks like creating user login form, building menus, authorization, CSS styling keep eroding our energy. Sadly, those tedious tasks are essential and we can not escape from.
Understanding the pain, we built a solution called Dashboard Framework. The framework handles for you all those hassle tasks and let you concentrate on what really matter. Some of its features are:
- Built-in authentication
- Allow authorization from application to data field
- Work with MySQL, Postgres, SQL Server, SQLite
- Support data from CSV, Excel files
- Support Data Caching at widget level
- Support multi-languages
- Support Multi-themes
- Beautiful single page application
- Support lazy loading for widgets
- Flexible three levels organized menus
- Work with other frameworks like Laravel, CodeIgniter, Yii2, Symfony
Phew! That's a lot of listings but those are not all. So you see, when you own a framework like this, why hassle can bother you from building great dashboard system for yourself or for your clients. Saving tons of time & efforts, keeping you focus on the importance, making you more productive, helping to serve more clients and bringing you more income eventually. If you feel our words unbelievable, let see its beauty and simplicity from the links below.
To see how beautiful it is, view our demo!
To see how simple it is, view dashboard source-code on Github!
Dashboard Framework will be your shortcut into the world of modern data reporting. With all of its benefits, we hope to have chance to serve you as our customer.
GET IT NOW!
Looking forward to serving you.
<3 KoolReport Team