KoolReport 3.25.4: How can I alphanumerically order my hAxis values?
Here is my code (the MySQL format of "BauchumfangMaenner" is MEDIUMINT):
<div class="col-md-12">
<?php
Table::create(array(
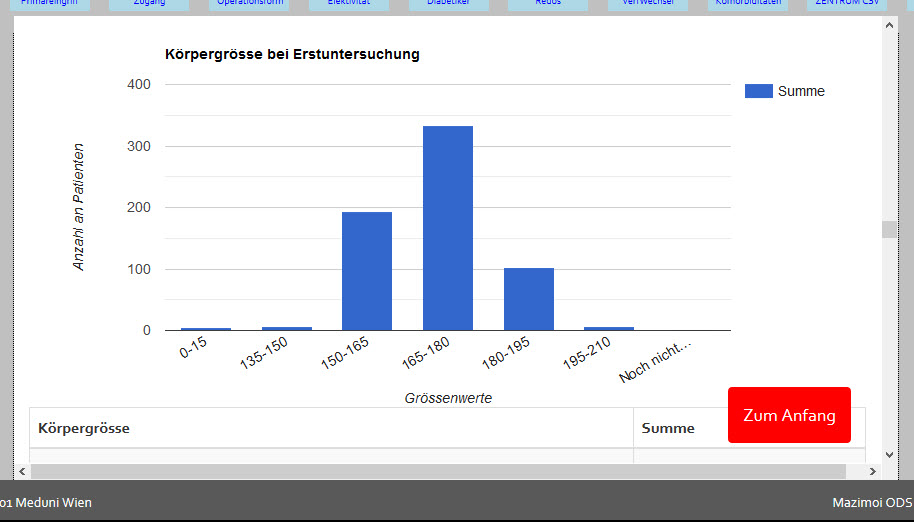
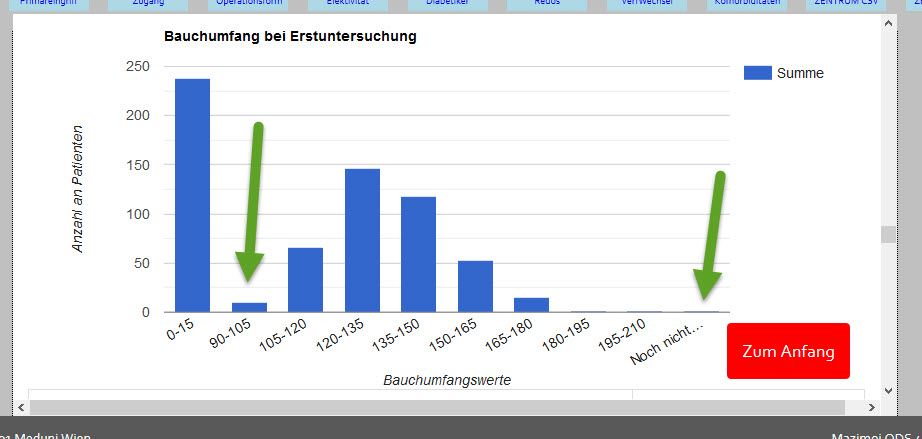
"title"=>"Bauchumfang bei Erstuntersuchung",
"dataSource"=>(
$this->src("patient")->query("
SELECT IFNULL(floor(ini.BauchumfangMaenner/15)*15, 'Noch nicht dokumentiert') as agerange, count(*) as Summe
FROM dat_patient p
LEFT JOIN dat_initialdaten ini ON ini.patID = p.ID
WHERE 1 = 1
-- AND (ini.BauchumfangMaenner IS NOT NULL AND ini.BauchumfangMaenner != -1)
AND NOT EXISTS (SELECT 1
FROM dat_initialdaten ini2
WHERE ini2.patID = p.ID AND ini2.revision > ini.revision
)
AND p.Testzwecke = 0
GROUP BY agerange
ORDER BY Summe ASC
")
->pipe(new CalculatedColumn(array(
"agerange"=>array(
"exp"=>function($row)
{
return $row["agerange"]."-".($row["agerange"]+15);
},
"type"=>"string"
))))
),
"options"=>array(
"chartArea"=>array(
right=> 130, // set this to adjust the legend with, shift the chartarea to left
width=>'100%' // Adjust the chart Area.
)
),
"cssClass"=>array(
"table"=>"table table-striped table-bordered"
),
"showFooter"=>"bottom",
"columns"=>array(
"agerange"=>array(
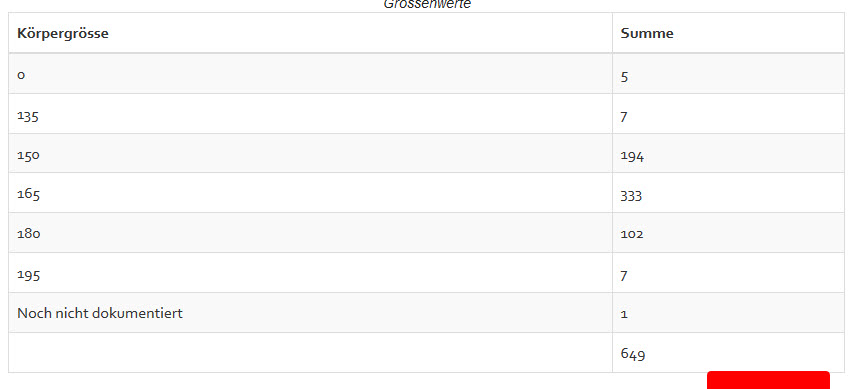
"footer"=>"Insgesamt"
),
"Summe"=>array(
"footer"=>"sum",
"footerText"=>"@value",
)
)
));
?>
</div>
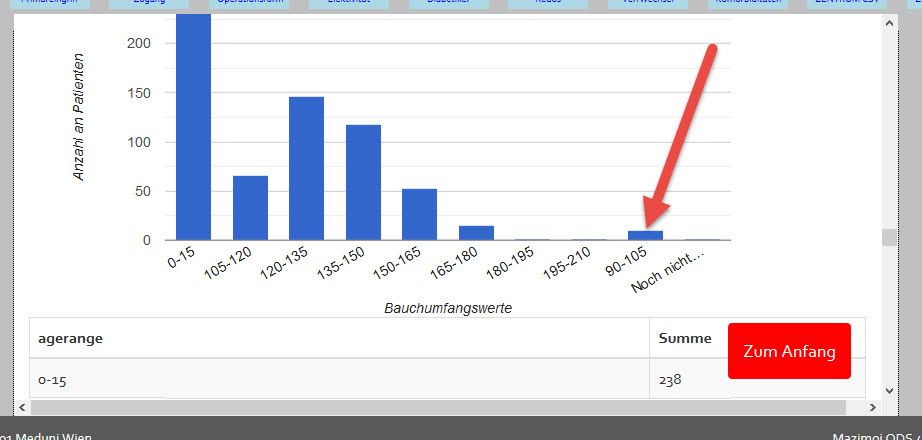
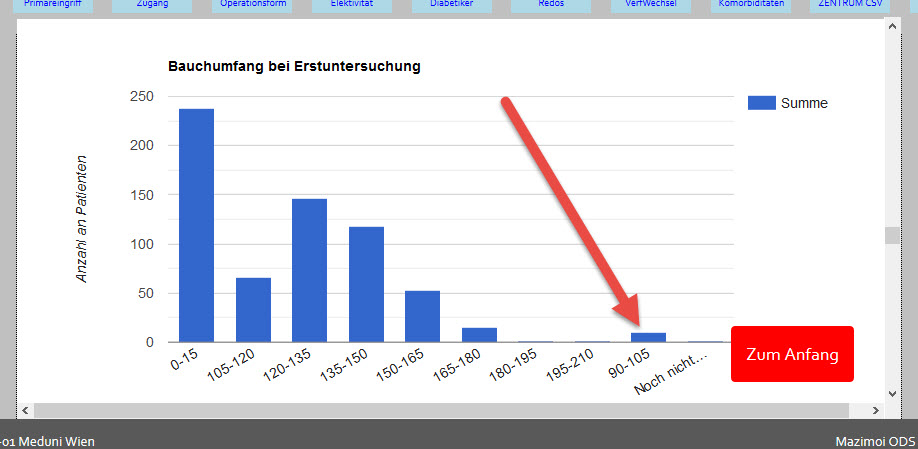
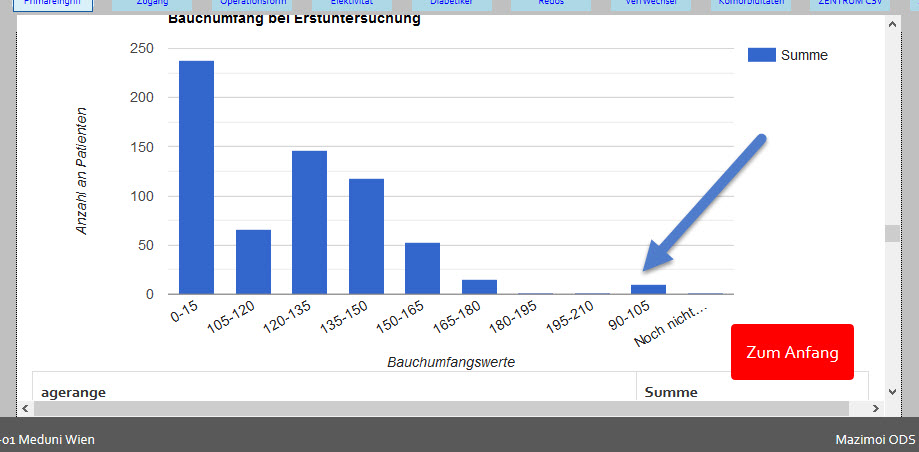
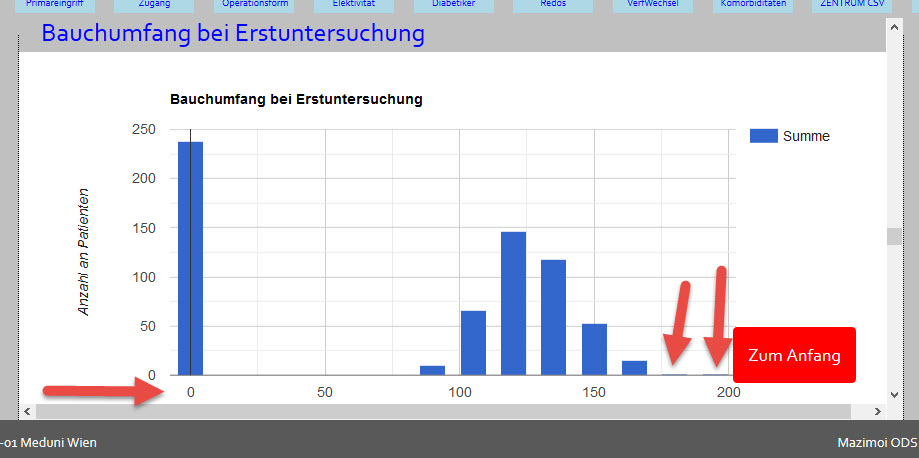
The result looks like the enclosed screenshot. As you can see, the values of 90 - 105 are penultimate in order, but should be second.
How can I solve this?