Hi,
I've just updated koolreport (composer) and checked my recent reports. In my export the Sparklines are not in the Datatable row but outside (before) the datatable.
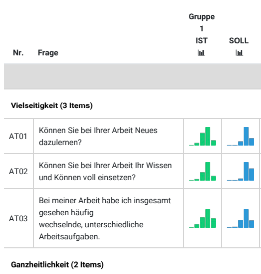
NOW:
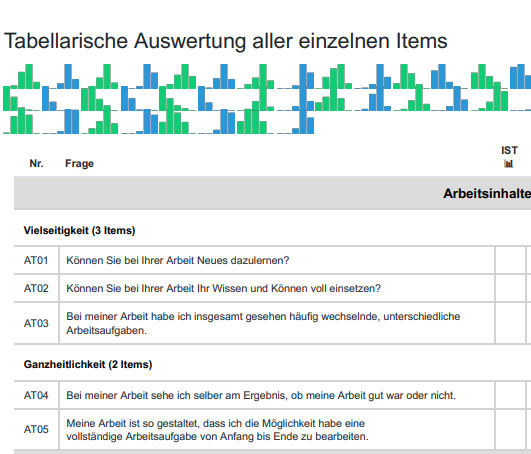
BEFORE:
Here is the related code:
"columns"=>array(
"Aspekt" => array(
"label" => "Bereich",
"type"=>"string",
),
"title" => array(
"label" => "Nr.",
"type"=>"string",
),
"Bereich" => array(
"label" => "Dimension",
"type"=>"string",
),
"question" => array(
"label" => "Frage",
"type"=>"string",
),
"a Verteilung" => array(
"label" => "IST <br> 📊",
'formatValue' => function($val, $row) use ($groups_data_verteilung, $report_group_main , $color) {
return sparklines\Bar::create(array(
"data" => $groups_data_verteilung[$report_group_main]['a'][$row["title"]],
"height"=>"35px",
"options"=>array(
"barWidth"=>"10px",
"barColor"=> $color['ist'],
),
));
}
),