KoolReport's Forum

Official Support Area, Q&As, Discussions, Suggestions and Bug reports.
Forum's Guidelines

Creating Chart with three data points #939

Open Matthew Bates opened this topic on on Jun 21, 2019 - 2 comments

Matthew Bates commented on Jun 21, 2019

I am trying to create a chart that shows number of items for each month (three different columns from SQL server). The SQL database has individual rows that contain among other data the following fields (date(a text field containing the date in the following format m/d/y) and equiptype(a text field containing the type of equipment). I am using a SQL select statement to count the number of each equipment type in each month. My SQL select statement is as follows:

SELECT date_format(str_to_date(date,'%m/%d/%Y)'),'%M') as Month, count(*), equiptype from Decom GROUP BY Month,equiptype

The data returned is as follows:

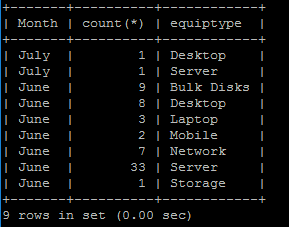
I would like my chart to look similar to the following:

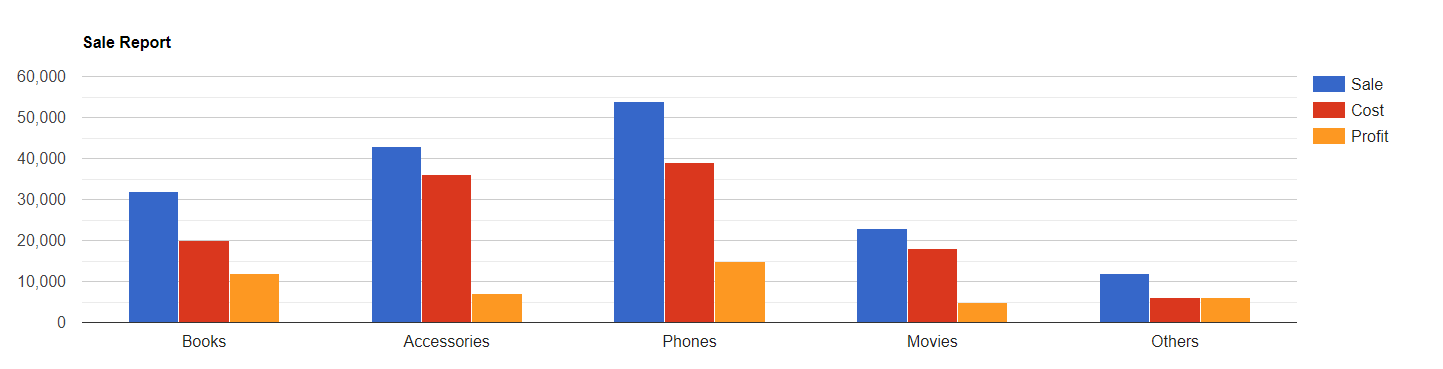
With Books, Accessories, etc being the Months and Sale, Cost, Profit being the type of equipment.

The code in my report file is a follows:

ColumnChart::create(array(
"title"=>"Disposals by Month",
"dataSource"=>$this->dataStore('permonth'),
"columns"=>array(
"Month",
"count(*)"=>array("label"=>"Number"),
"equiptype",
)
));

This gives me an error of All series on a given axis must be of the same data type. I can take out one of either Month or equiptype and get either number of records for each month or number of records for each equipment type, but cannot get a list of months with the number of each equipment type for that month. What am I missing?

David Winterburn commented on Jun 24, 2019

Hi Matthew,

Please try the Cube process before saving the data to a datastore:

$this->src(...)
...
->pipe(new \koolreport\cube\Cube(
    "row" => "Month",
    "column" => "equiptype",
    "sum" => "count(*)",
))
->pipe($this->dataStore('perMonth'));

After that you could show the data in "perMonth" with either table or chart. Let us know if there's any issue. Thanks!

Matthew Bates commented on Jun 25, 2019

I was able to get this working without using Cube, since I don't have the license for this function. I was able to get it working by accessing the sql data passed over in the array and providing the data in the format that the chart function is looking for.

<?php
use \koolreport\widgets\google\ColumnChart;
$data=array($this->datastore('permonth'));
$report=array(array("category"=>"January"));
$report[1]["category"]="February";
$report[2]["category"]="March";
$report[3]["category"]="April";
$report[4]["category"]="May";
$report[5]["category"]="June";
$report[6]["category"]="July";
$report[7]["category"]="August";
$report[8]["category"]="September";
$report[9]["category"]="October";
$report[10]["category"]="November";
$report[10]["category"]="December";
$continue = "True";
$i = 0;
while ($continue == "True")
{
  switch ($data[0][$i]["equiptype"])
   {
     case "Desktop":
        $equip = "Desktop";
        break;
     case "Server":
        $equip = "Server";
        break;
     case "Bulk Disks";
        $equip = "Bulk Disks";
        break;
     case "Laptop";
        $equip = "Laptop";
        break;
     case "Mobile";
        $equip = "Mobile";
        break;
     case "Network";
        $equip = "Network";
        break;
     case "Storage";
        $equip = "Storage";
        break; 
     case "";
        $continue = "False";
        break;
   }
   switch ($data[0][$i]["Month"])
   {
     case "January":
       $report[0]["$equip"]=$data[0][$i]["count(*)"];
       break;
     case "February":
       $report[1]["$equip"]=$data[0][$i]["count(*)"];
       break;
     case "March":
       $report[2]["$equip"]=$data[0][$i]["count(*)"];
       break;
     case "April":
       $report[3]["$equip"]=$data[0][$i]["count(*)"];
       break;
     case "May":
       $report[4]["$equip"]=$data[0][$i]["count(*)"];
       break;
     case "June":
       $report[5]["$equip"]=$data[0][$i]["count(*)"];
       break;
     case "July":
       $report[6]["$equip"]=$data[0][$i]["count(*)"];
       break;
     case "August":
       $report[7]["$equip"]=$data[0][$i]["count(*)"];
       break;
     case "September":
       $report[8]["$equip"]=$data[0][$i]["count(*)"];
       break;
     case "October":
       $report[9]["$equip"]=$data[0][$i]["count(*)"];
       break;
     case "November":
       $report[10]["$equip"]=$data[0][$i]["count(*)"];
       break;
     case "December":
       $report[11]["$equip"]=$data[0][$i]["count(*)"];
       break; 
   }
$i++;
}
?>
<div class="report-content">
   <div class="text-center">
   <h1>Disposal by Month</h1>
</div>
<?php
ColumnChart::create(array(
"title"=>"Disposals by Month",
"dataSource"=>$report,
"columns"=>array(
   "category",
   "Server"=>array("label"=>"Servers"),
   "Desktop"=>array("label"=>"Desktops"),
   "Laptop"=>array("label"=>"Laptops"),
   "Storage"=>array("label"=>"Storage"),
   "Bulk Disks"=>array("label"=>"Bulk Disks"),
   "Network"=>array("label"=>"Network"),
   "Mobile"=>array("label"=>"Mobile"),
  )
));
?>
</div>

Build Your Excellent Data Report

Let KoolReport help you to make great reports. It's free & open-source released under MIT license.

Download KoolReport View demo
solved

None