KoolReport's Forum

Official Support Area, Q&As, Discussions, Suggestions and Bug reports.
Forum's Guidelines

ColumnMeta being ignored with KoolReport 4.0 #915

Closed Ardan Peddell opened this topic on on Jun 9, 2019 - 10 comments

Ardan Peddell commented on Jun 9, 2019

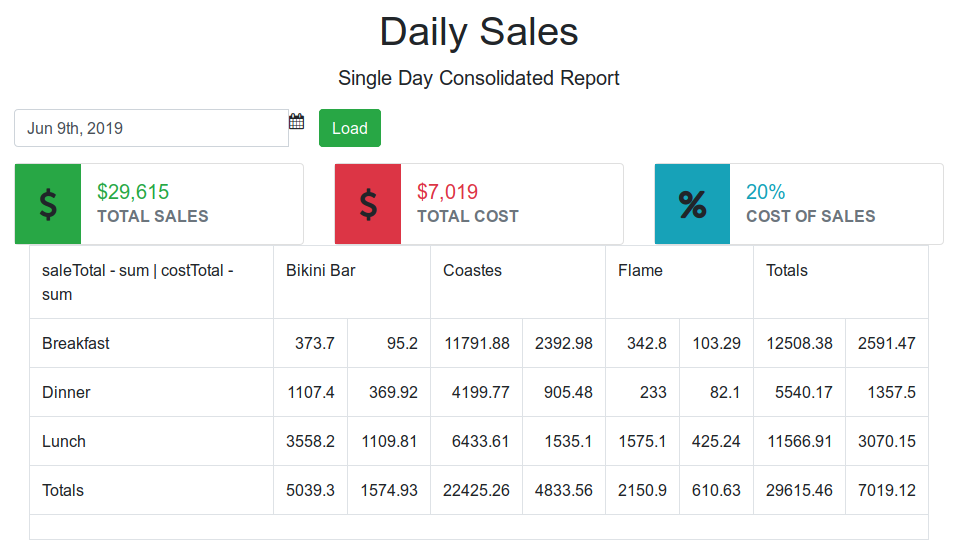
Hi guys, I have just updated to V4 and all my reports that use ColumMeta to format the data, such as setting number of decimal places, seems to have stopped working.

Prior to V4 the reports that have decimals set to 0, are now showing the raw data.

Is this a bug, or is there a change in the ColumnMeta formatting?

Thanks

Code as follows:-

PosSalesCovers.php

<?php
require_once "../../../koolreport/core/autoload.php";

//Disable memory_limit by setting it to minus 1.
ini_set("memory_limit", "-1");
//Disable the time limit by setting it to 0.
set_time_limit(0);

use \koolreport\processes\Filter;
use \koolreport\processes\ColumnMeta;
use \koolreport\pivot\processes\Pivot;
use \koolreport\processes\CalculatedColumn;

class PosSalesCovers extends koolreport\KoolReport
{
  use \koolreport\cache\FileCache;
  use \koolreport\export\Exportable;
  use \koolreport\excel\ExcelExportable;
  use \koolreport\inputs\Bindable;
  use \koolreport\inputs\POSTBinding;
//  use \koolreport\amazing\Theme;
//  function cacheSettings()
//  {
//      return array(
//          "ttl"=>60,
//      );
//  }

  function defaultParamValues()
  {
      return array(
        "dateRange"=>array(date("Y-m-d"),date("Y-m-d")),
        "outlets"=>array(),
      );
  }

  function bindParamsToInputs()
  {
      return array(
          "dateRange"=>"dateRange",
          "outlets"=>"outlets",
      );
  }
  function settings()

    {
  //      //Get default connection from config.php
        $config = include "../../config.php";
        return array(
            "dataSources"=>array(
                "pos"=>$config["pos"]
            )
        );
    }

  function setup()
    {
        $this->src('pos')
        ->query("SELECT
            outlet_name AS outletName,
            outlet_id AS outlet_id,
            YEAR(business_date) AS businessYear,
            MONTH(business_date) AS businessMonth,
            DAY(business_date) AS businessDay,
            shift_name AS shiftName,
            category AS categoryMain,
            SUM(sale_total) AS sale_total
        FROM pos.report_shift_category_sales
        JOIN salesareas
        ON salesareas.id = outlet_id
        ".
          (($this->params["outlets"]!=array())?"AND salesareas.id IN (:outlets)":"")
        ."
        WHERE business_date BETWEEN :start AND :end
        GROUP BY business_date, outlet_id, category, shift_name
        ")
        ->params(array(
            ":start"=>$this->params["dateRange"][0],
            ":end"=>$this->params["dateRange"][1],
            ":outlets"=>$this->params["outlets"]
         ))
        ->pipe(new ColumnMeta(array(
            "sale_total"=>array(
            'type' => 'number',
            "decimals"=>0,
            "prefix" => "$",
            ),
        )))
        ->pipe(new Pivot(array(
            "dimensions" => array(
              "column" => "categoryMain",
              "row" => "businessYear, businessMonth, businessDay, outletName, shiftName",
            ),
            "aggregates"=>array(
                "sum" => "sale_total",
            )
        )))
        ->pipe($this->dataStore('shift_sales'));

        $this->src('pos')
        ->query("SELECT
            outlet_name AS outletName,
            shift_name AS shiftName,
            YEAR(business_date) AS businessYear,
            MONTH(business_date) AS businessMonth,
            DAY(business_date) AS businessDay,
            business_hour AS businessHour,
	          COUNT(DISTINCT(receipt_id)) AS receiptQty,
            SUM( sale_amount ) AS sale_total,
            SUM( no_of_pax ) AS paxQty,
            pos.salesareas.occupancy AS occupancy
          FROM pos.salesareas
            INNER JOIN pos.report_shift_covers_sales
            ON pos.salesareas.id = pos.report_shift_covers_sales.outlet_id
          WHERE business_date BETWEEN :start AND :end
          GROUP BY business_date,outlet_id,shift_name,business_hour
          ")
          ->params(array(
              ":start"=>$this->params["dateRange"][0],
              ":end"=>$this->params["dateRange"][1]
           ))
          ->pipe(new CalculatedColumn(array(
            "covers_per_receipt"=>"{paxQty}/{receiptQty}",
            "sales_per_receipt"=>"{sale_total}/{receiptQty}",
            "sales_per_pax"=>"{sale_total}/{paxQty}",
            "occupancy_pct"=>"{paxQty}/{occupancy}*100"
          )))
          ->pipe(new ColumnMeta(array(
              "receiptQty"=>array(
              'type' => 'number',
              ),
              "sale_total"=>array(
              'type' => 'number',
              "decimals"=>0,
              "prefix" => "$",
              ),
              "paxQty"=>array(
              'type' => 'number',
              ),
              "covers_per_receipt"=>array(
              'type' => 'number',
              "decimals"=>1,
              ),
              "sales_per_receipt"=>array(
              'type' => 'number',
              "decimals"=>0,
              "prefix" => "$",
              ),
              "sales_per_pax"=>array(
              'type' => 'number',
              "decimals"=>0,
              "prefix" => "$",
              ),
              "occupancy_pct"=>array(
              'type' => 'number',
              "decimals"=>0,
              "suffix" => "%",
              ),
           )))
           ->pipe(new Pivot(array(
               "dimensions" => array(
                 "column" => "",
                 "row" => "businessYear, businessMonth, businessDay, outletName, shiftName",
               ),
               "aggregates"=>array(
                 "sum" => "receiptQty,sale_total,paxQty",
                 "avg" => "covers_per_receipt,sales_per_receipt,occupancy_pct",
               )
           )))

        ->pipe($this->dataStore('covers_sales'));

        $this->src("pos")
        ->query("SELECT id,name FROM salesareas
            WHERE parent_id IS NULL AND house_id = 1
            ORDER BY name")
        ->pipe($this->dataStore("outlets"));

    }
}

PosSalesCovers.view.php

<?php
    use \koolreport\pivot\widgets\PivotMatrix;
    use \koolreport\pivot\widgets\PivotTable;
    use \koolreport\pivot\processes\Pivot;
    use \koolreport\instant\Widget;
    use \koolreport\inputs\DateRangePicker;
    use \koolreport\inputs\MultiSelect;

?>

<div class="report-content">

  <div class="text-center">
        <h1>Shift Matrix Reports</h1>
        <p class="lead">Sales and Covers reports by date range</p>
  </div>

  <form method="post">
    <input type='hidden' name='koolPivotUpdate' />
    <div class="row">
      <div class="col-md-8 offset-md-2">
        <div class="form-group">
          <?php
          DateRangePicker::create(array(
          "name"=>"dateRange"
                ));
                ?>
                </div>
                <div class="form-group">
                <?php
                MultiSelect::create(array(
                    "name"=>"outlets",
                    "dataStore"=>$this->dataStore("outlets"),
                    "dataBind"=>array(
                        "text"=>"name",
                        "value"=>"id",
                    ),
                    "attributes"=>array(
                        "class"=>"form-control",
                        "size"=>5,
                    )
                ));
                ?>
              </div>
            <div class="form-group text-center">
                <button class="btn btn-success"><i class="glyphicon glyphicon-refresh"></i> Load</button>
            </div>
        </div>
      </div>
      <div class="text-center">
          <h2>Shift Sales Data</h2>
      </div>
      <?php
      PivotMatrix::create(array(
          "id" => "pivotMatrix_1",
          'dataSource' => $this->dataStore('shift_sales'),
//            'rowCollapseLevels' => array(2),
//            'columnCollapseLevels' => array(0,0,0),
//            'hideSubtotalRow' => true,
          'hideSubtotalColumn' => true,
//            'hideTotalRow' => true,
//            'hideTotalColumn' => true,
//            'showDataHeaders' => true,

//            'template' => 'PivotMatrix-Bun',
          "measures"=>array(
              "sale_total - sum",
          ),

//            'width' => '100%',
          'height' => '900px',
          'headerMap' => function($v, $f) {
              switch ($v) {
                  case 'sale_total - sum': return 'Total Sales';
                  case 'businessYear': return 'Year';
                  case 'businessMonth': return 'Month';
                  case 'businessDay': return 'Day';
                  case 'outletName': return 'Outlet';
                  case 'shiftName': return 'Shift';
                  case 'categoryMain': return 'Category';
              }
              $r = $v;
              if ($f === 'businessYear')
              $r =  $v;
              $map = array(
                  '1' => 'JAN',
                  '2' => 'FEB',
                  '3' => 'MAR',
                  '4' => 'APR',
                  '5' => 'MAY',
                  '6' => 'JUN',
                  '7' => 'JUL',
                  '8' => 'AUG',
                  '9' => 'SEP',
                  '10' => 'OCT',
                  '11' => 'NOV',
                  '12' => 'DEC',
              );
              if ($f === 'businessMonth')
              $r = $map[$v];
              return $r;
          },
          'totalName' => 'Total',
          'paging' => array(
              'size' => 20,
              'maxDisplayedPages' => 5,
              'sizeSelect' => array(5, 10, 15, 20, 50)
          )
      ));
      ?>
      <div class="text-center">
          <h2>Cover Sales Data</h2>
      </div>
      <?php
      PivotMatrix::create(array(
          "id" => "pivotMatrix_2",
          'dataSource' => $this->dataStore('covers_sales'),
          'rowCollapseLevels' => array(2),
          'hideSubtotalRow' => true,
          'hideSubtotalColumn' => true,
//            'template' => 'PivotTable-Bun',
          "measures"=>array(
              "receiptQty - sum",
              "sale_total - sum",
              "paxQty - sum",
              "covers_per_receipt - avg",
              "sales_per_receipt - avg",
              "occupancy_pct - avg",
          ),
          'showDataHeaders' => true,
          'width' => '100%',
          'height' => '900px',
          'headerMap' => function($v, $f) {
              switch ($v) {
                  case 'sale_total - sum': return 'Total Sales';
                  case 'receiptQty - sum': return 'Total Bills';
                  case 'paxQty - sum': return 'Total Covers';
                  case 'covers_per_receipt - avg': return 'Covers per Bill';
                  case 'sales_per_receipt - avg': return 'Sales per Bill';
                  case 'sales_per_pax - avg': return 'Sales per Cover';
                  case 'occupancy_pct - avg': return 'Occupancy';
                  case 'businessYear': return 'Year';
                  case 'businessMonth': return 'Month';
                  case 'businessDay': return 'Day';
                  case 'outletName': return 'Outlet';
                  case 'shiftName': return 'Shift';
                  case 'businessHour': return 'Hour';
              }
              $r = $v;
              if ($f === 'businessYear')
              $r =  $v;
              $map = array(
                  '1' => 'JAN',
                  '2' => 'FEB',
                  '3' => 'MAR',
                  '4' => 'APR',
                  '5' => 'MAY',
                  '6' => 'JUN',
                  '7' => 'JUL',
                  '8' => 'AUG',
                  '9' => 'SEP',
                  '10' => 'OCT',
                  '11' => 'NOV',
                  '12' => 'DEC',
              );
              if ($f === 'businessMonth')
              $r = $map[$v];
              $map = array(
                  '1' => '8am',
                  '2' => '9am',
                  '3' => '10am',
                  '4' => '11am',
                  '5' => '12pm',
                  '6' => '1pm',
                  '7' => '2pm',
                  '8' => '3pm',
                  '9' => '4pm',
                  '10' => '5pm',
                  '11' => '6pm',
                  '12' => '7pm',
                  '13' => '8pm',
                  '14' => '9pm',
                  '15' => '10pm',
                  '16' => '11pm',
                  '17' => '12am',
                  '18' => '1am',
                  '19' => '2am',
                  '20' => '3am',
                  '21' => '4am',
                  '22' => '5am',
                  '23' => '6am',
                  '24' => '7am',
              );
              if ($f === 'businessHour')
              $r = $map[$v];
              return $r;
          },
          'totalName' => 'Total',
          'waitingFields' => array(
              'sales_per_pax - avg' => 'data',
              'Hour' => 'label',
          ),
          'paging' => array(
              'size' => 20,
              'maxDisplayedPages' => 5,
              'sizeSelect' => array(5, 10, 15, 20, 50)
          )
      ));
      ?>
    </form>
  </div>
KoolReport commented on Jun 9, 2019

We do not make change to ColumnMeta. Could you please post your code, I would like to see.

Ardan Peddell commented on Jun 9, 2019

Hi, following is another example of a report that doesn't seem to pass the ColumnMeta formatting:-

<?php

require_once "../../../koolreport/core/autoload.php";

use \koolreport\processes\Filter;
use \koolreport\processes\ColumnMeta;
use \koolreport\pivot\processes\Pivot;
use \koolreport\processes\Group;
use \koolreport\processes\CalculatedColumn;

class DailySalesReport2 extends koolreport\KoolReport
{
//  use \koolreport\amazing\Theme;
  use \koolreport\inputs\Bindable;
  use \koolreport\inputs\POSTBinding;
  use \koolreport\export\Exportable;

  protected function defaultParamValues()
  {
      return array(
          "reportDate"=>date("Y-m-d"),
      );
  }

  protected function bindParamsToInputs()
  {
      return array(
          "reportDate",
      );
  }

    function settings()
    {
  //      //Get default connection from config.php
        $config = include "../../config.php";
        return array(
            "dataSources"=>array(
                "pos"=>$config["pos"]
            )
        );
    }

    function setup()
    {
      $this->src('pos')
      ->query("SELECT
          outlet_name AS outletName,
          shift_name AS shiftName,
          category AS categoryMain,
          sale_total AS saleTotal,
          cost_total AS costTotal,
          ROUND((cost_total / sale_total * 100),2) AS cosTotal
                FROM pos.report_shift_category_sales
                WHERE business_date = :start
                ")
      ->params(array(
            ":start"=>$this->params["reportDate"]
      ))
      ->saveTo($node1);

       $node1->pipe(new ColumnMeta(array(
            "saleTotal"=>array(
            'type' => 'number',
            "decimals"=>0,
            "prefix" => "$",
            ),
            "costTotal"=>array(
            'type' => 'number',
            "decimals"=>0,
            "prefix" => "$",
            ),
         )))
         ->pipe(new Pivot(array(
             "dimensions"=>array(
                 "row" => "shiftName",
                 "column" => "outletName"
             ),
             "aggregates"=>array(
                 "sum"=>"saleTotal,costTotal",
                 "avg"=>"cosTotal"
             )
         )))
        ->pipe($this->dataStore('categorySales'));

        $node1->pipe(new ColumnMeta(array(
             "saleTotal"=>array(
             'type' => 'number',
             "decimals"=>0,
             "prefix" => "$",
             ),
             "costTotal"=>array(
             'type' => 'number',
             "decimals"=>0,
             "prefix" => "$",
             ),
          )))
          ->pipe(new Pivot(array(
              "dimensions"=>array(
                  "row" => "categoryMain",
                  "column" => "outletName"
              ),
              "aggregates"=>array(
                  "sum"=>"saleTotal,costTotal",
                  "avg"=>"cosTotal"
              )
          )))
         ->pipe($this->dataStore('shiftSales'));

         $node1->pipe(new Group(array(
              "by"=>"",
              "sum"=>"saleTotal,costTotal",
              "avg"=>"cosTotal"
          )))
          ->pipe($this->dataStore('daySalesTotal'));
    }
}

<?php
    use \koolreport\inputs\DateTimePicker;
    use \koolreport\pivot\widgets\PivotTable;
    use \koolreport\amazing\SimpleCard;

?>

<div class="report-content">
  <div class="text-center">
    <h1>Daily Sales</h1>
    <p class="lead">Single Day Consolidated Report
    </p>
  </div>

  <form method="post">
    <input type='hidden' name='koolPivotUpdate' />
    <div class='row'>
      <div class="col-md-4">
        <div class="form-group">
        <?php DateTimePicker::create(array("name"=>"reportDate")); ?>
        </div>
      </div>
      <div class="form-group text-center">
         <button class="btn btn-success"><i class="glyphicon glyphicon-refresh"></i> Load</button>
      </div>
    </div>
  </form>
  <div class="row">
      <div class="col-sm-4">
      <?php
      SimpleCard::create(array(
          "title"=>"Total Sales",
          "value"=>$this->dataStore("daySalesTotal")->sum("saleTotal"),
          "preset"=>"success",
          "format"=>array(
              "value"=>array(
                  "prefix"=>"$"
              )
          ),
          "cssClass"=>array(
              "icon"=>"fa fa-dollar",
          ),
          "cssStyle"=>array(
              "title"=>"font-weight:bold",
              "icon"=>"font-size:32px"
          )
      ));
      ?>
      </div>
      <div class="col-sm-4">
      <?php
      SimpleCard::create(array(
              "title"=>"Total Cost",
              "value"=>$this->dataStore("daySalesTotal")->sum("costTotal"),
              "preset"=>"danger",
              "format"=>array(
                  "value"=>array(
                      "prefix"=>"$"
                  )
              ),
              "cssClass"=>array(
                  "icon"=>"fa fa-dollar",
              ),
              "cssStyle"=>array(
                  "title"=>"font-weight:bold",
                  "icon"=>"font-size:32px"
              )
          ));
          ?>
          </div>
          <div class="col-sm-4">
          <?php
          SimpleCard::create(array(
                  "title"=>"Cost of Sales",
                  "value"=>$this->dataStore("daySalesTotal")->avg("cosTotal"),
                  "preset"=>"info",
                  "format"=>array(
                      "value"=>array(
                          "suffix"=>"%"
                      )
                  ),
                  "cssClass"=>array(
                      "icon"=>"fa fa-percent",
                  ),
                  "cssStyle"=>array(
                      "title"=>"font-weight:bold",
                      "icon"=>"font-size:32px"
                  )
              ));
              ?>
              </div>
  </div>
  </div>
  <div class="col-sm-12">

    <?php
    PivotTable::create(array(
              "id" => "pivotTable1",
              "dataSource"=>$this->dataStore('categorySales'),
  //            'template' => 'PivotMatrix-Bun',
  //            'hideSubtotalRow' => true,
              "hideSubtotalColumn" => true,
  //            'hideTotalRow' => true,
  //            'hideTotalColumn' => true,
  //            'rowCollapseLevels' => array(0),
  //            'columnCollapseLevels' => array(0),
              "measures"=>array(
                  "saleTotal - sum",
                  "costTotal - sum",
  //                "cosTotal - avg",
              ),
  //            "showDataHeaders" => true,
  //            'width' => '800px',
  //            'height' => '800px',
              "totalName" => "Totals",
  //            'columnWidth' => '100px',
    ));
    ?>
    <?php
    PivotTable::create(array(
              "id" => "pivotTable2",
              "dataSource"=>$this->dataStore('shiftSales'),
  //            'template' => 'PivotMatrix-Bun',
  //            'hideSubtotalRow' => true,
              "hideSubtotalColumn" => true,
  //            'hideTotalRow' => true,
  //            'hideTotalColumn' => true,
  //            'rowCollapseLevels' => array(0),
  //            'columnCollapseLevels' => array(0),
              "headerMap" => array(
                  "saleTotal - sum" => "Total Sales",
                  "costTotal - sum" => "Total Cost",
  //                'cosTotal - avg' => 'Cos',
              ),
              "measures"=>array(
                  "saleTotal - sum",
                  "costTotal - sum",
  //                "cosTotal - avg",
              ),
  //            "showDataHeaders" => true,
  //            'width' => '800px',
  //            'height' => '800px',
              "totalName" => "Totals",
  //            'columnWidth' => '100px',
    ));
    ?>
  </div>

</div>

Results as folows:-

David Winterburn commented on Jun 10, 2019

Hi Ardan,

We've fixed this issue with the newly released version 6.1.0 of Pivot in KoolReport Pro 4.1.0. Please try installing the new version and let us know if it fixes the issue for you. Thanks!

Keith Burke commented on Jun 10, 2019

Nope. Problem still persists with 4.1.0.

Ardan Peddell commented on Jun 10, 2019

Looks like that did the trick. ColumnMeta process seems to process the data now as expected. Will test further and let you know if any issues. Thank you for the quick work

Ardan Peddell commented on Jun 10, 2019

One issue - I think headerMap doesn't seem to be working and more. It does work as expected in V3.25.4

Keith Burke commented on Jun 10, 2019

Yup, It's the headerMap that isn't working for me.

David Winterburn commented on Jun 11, 2019

Thanks for your all feedback! We've fixed the issue with "headerMap" and it will be available soon.

David Winterburn commented on Jun 11, 2019

Hi,

Please try installing Pivot 6.1.1 and see if it fixes the "headerMap" property for you. Thanks!

Ardan Peddell commented on Jun 11, 2019

Hi David, Just tested and headerMap is working again - thanks for the fix.

Build Your Excellent Data Report

Let KoolReport help you to make great reports. It's free & open-source released under MIT license.

Download KoolReport View demo
solved

None