KoolReport's Forum

Official Support Area, Q&As, Discussions, Suggestions and Bug reports.
Forum's Guidelines

Data Table with KPI indicators #826

Open Rajesh opened this topic on on Apr 24, 2019 - 4 comments

Rajesh commented on Apr 24, 2019

Hello,

We are new to KoolReport and are working on building POC using KoolReport Pro for our project. Could you please help us with below questions?

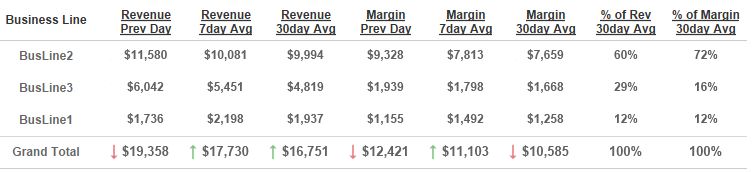
1)Is it possible to build below data table with KPI indicators?

2)In below data table, the Grand Total KPI arrows are comparing most recent two days data and if it is positive then it is green arrow, when negative then it is red arrow.

3)We would like to know if there is any example or code snippet for building any data table with KPI indicators?

We did search on your forums but did not find anything that is related to KPI indicators. Please let us know in case we missed finding any old questions like this requirement.

Thanks,

Rajesh.

David Winterburn commented on Apr 25, 2019

Hi,

Would you please explain more specifically why Revenue Prev Day is down, Rev 7day Avg is up, Revenue 30day Avg is up and which data points you compare them to and are those compared data points available in this table?

As long as data for comparison is available our data processes could create KPI for you. Thanks!

Rajesh commented on Apr 25, 2019

Hi David,

Thank you for the response. Sorry for not being detailed in the initial post. Please find details below.

Revenue Prev Day red arrow is down because Revenue Prev 2nd Day was more than $19,358.

Rev 7day Avg green arrow is up because it is comparing with Revenue Prev Day and since Rev Prev Day is more it is showing green up arrow.To be more specific, since $19,358 is more than $17,730 it is showing up arrow.

Rev 30day Avg green arrow is up because it is also comparing with Revenue Prev Day and since Rev Prev Day is more it is showing green up arrow.To be more specific, since $19,358 is more than $16,751, it is showing up arrow.

When you hover on the up/down arrows, we show a tooltip which exactly shows to which data it is comparing. Also, the Business Line column would be drilldown like a pivot table which would provide details by account when clicked on it.

We have a sql table which makes all calculations and populates the aggregate data and based on that sql table we have created above table view in our BI tool currently. We want to try and implement the same using KoolReport.

I did not understand what you meant by "our data processes could create KPI for you". Could you please be more specific?

Thanks,

Rajesh.

David Winterburn commented on Apr 26, 2019

Hi Rajesh,

Thanks for your detailed explanation. Let me present 2 solutions for your problem.

1 The first one manipulate the data directly in the report setup function:

//MyReport.php
->pipe(new \koolreport\processes\Map(array(
            '{value}' => function($row) {
                if ($row["Business Line"] === "Grand Total") {
                    $kpi = $row["Rev Prev Day"] >= $row["Rev Prev 2nd Day"] ?
                        "<up-arrow>" : "<down-arrow>"; //replace up-arrow and down-arrow with your arrow icon (font-awesome, bootstrap, etc)
                    $row["Rev Prev Day"] = $kpi . $row["Rev Prev Day"];

                    $kpi = $row["Rev Prev Day"] >= $row["Rev 7day Avg"] ?
                        "<up-arrow>" : "<down-arrow>";
                    $row["Rev 7day Avg"] = $kpi . $row["Rev 7day Avg"];

                    $kpi = $row["Rev Prev Day"] >= $row["Rev 30day Avg"] ?
                        "<up-arrow>" : "<down-arrow>";
                    $row["Rev 30day Avg"] = $kpi . $row["Rev 30day Avg"];
                }

                return $row;
            },
        )))

2 The second one keeps data the same but change its displaying value in the report view file:

//MyReport.view.php
DataTables::create(array(
        "dataSource" => $this->dataStore("reportData"),
        ...
        "columns"=>array(
            ...
            'Rev Prev Day' => [
                'formatValue' => function($value, $row) {
                    if ($row["Business Line"] === "Grand Total") {
                        $kpi = $value >= $row["Rev Prev 2nd Day"] ?
                            "<up-arrow>" : "<down-arrow>"; //replace up-arrow and down-arrow with your arrow icon (font-awesome, bootstrap, etc)
                        $value = $kpi . $value;
                        return $value;
                    } else {
                        return $value;
                    }
                }
            ],
            //similarly for other columns
            ...
        ),
        ...
    ));

Please try either solution and let us know if it meets your requirement. Thanks!

Rajesh commented on May 1, 2019

Hi David,

Thanks for the solutions. We went with second solution and it helped resolve the issue.

Thanks,

Rajesh.

Build Your Excellent Data Report

Let KoolReport help you to make great reports. It's free & open-source released under MIT license.

Download KoolReport View demo
help needed
solved

None