KoolReport's Forum

Official Support Area, Q&As, Discussions, Suggestions and Bug reports.
Forum's Guidelines

ColumnChart not showing Properly in laravel #773

Closed vudoc opened this topic on on Apr 2, 2019 - 6 comments

vudoc commented on Apr 2, 2019

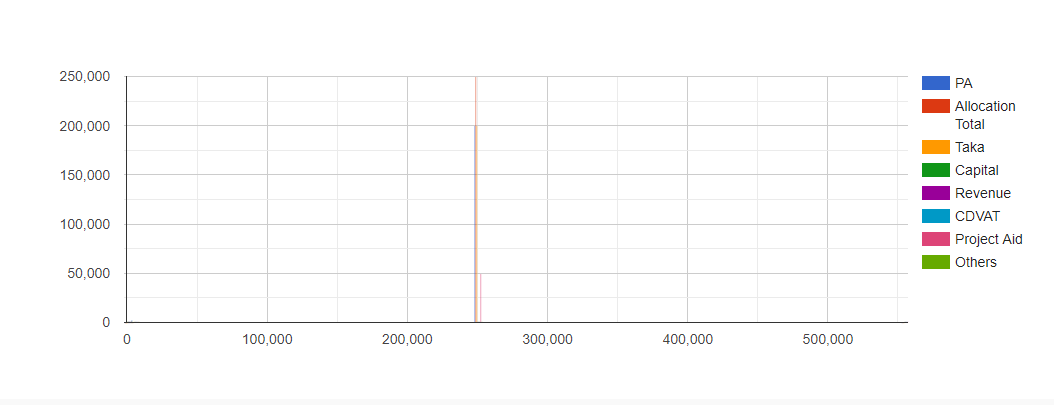
Bar is not visible, My View right now,

my code,

 use \koolreport\laravel\Friendship;
    use \koolreport\cloudexport\Exportable;   
    //We leave this blank to demo only  
    public function settings()
    {
     return array(       
         'assets' => array(
                'path' => public_path(),
                'url' => '',
            ),      
        );
    }
    function setup()
    {
     $min = $this->params["min"];
     $agen = $this->params["agen"];
     $sec = $this->params["sec"];
     $sub_sec = $this->params["sub_sec"];
     
     $this->src("mysql")->query(MySQL::type(
            DB::table("demands")->join('approved_project_info', 'approved_project_info.unapprove_project_id', '=', 'demands.project_id')
           ->where('ministry', $min)     
           ))
        ->pipe($this->dataStore('demands')); 
    }
KoolReport commented on Apr 2, 2019

May I see your report view? Especially the part that you created the chart

vudoc commented on Apr 2, 2019

Yes off course, Right Here,

<?php

    ColumnChart::create(array(
    "dataStore"=>$this->dataStore('demands'),  
    "columns" => array(
        
            "project_cost_total" => array(
                "label" => "Total",
                 "footer"=>"sum",
            ),
            "project_aid" => array(
                "label" => "PA",
                 "footer"=>"sum",
            ),
            //6 row start
            //6 row end  
            "allocation_total" => array(
                "label" => "Allocation Total",
                "footer"=>"sum",
            ),
            "allocation_taka" => array(
                "label" => "Taka",
                 "footer"=>"sum",
            ),
            "capital" => array(
                "label" => "Capital ",
                 "footer"=>"sum",
            ),
            "capital_revenue" => array(
                "label" => "Revenue",
                 "footer"=>"sum",
            ),
            "cdvat" => array(
                "label" => "CDVAT",
                 "footer"=>"sum",
            ),
            "cdvat_pa" => array(
                "label" => "Project Aid",
                 "footer"=>"sum",
            ),
            "allocation_others" => array(
                "label" => "Others",
                 "footer"=>"sum",
            ),
        ),
        "width"=>"100%",
    ));
    
    
?>

My Blade View,

<?php echo $report->render(); ?>

KoolReport commented on Apr 2, 2019

The first columns will be use for category in x-axis, the rest of columns will be used for y-axis value. So basically your chart you use the project_cost_total as category which seems to me is not correct.

vudoc commented on Apr 2, 2019

I am trying, Please let me know if you have any suggestion

vudoc commented on Apr 2, 2019

Your suggestion worked, Thank You best support team

KoolReport commented on Apr 2, 2019

Awesome!

Build Your Excellent Data Report

Let KoolReport help you to make great reports. It's free & open-source released under MIT license.

Download KoolReport View demo
help needed
solved

Laravel