KoolReport's Forum

Official Support Area, Q&As, Discussions, Suggestions and Bug reports.
Forum's Guidelines

How to make ColumnChart have columns side by side? #728

Closed Markus Mohr opened this topic on on Mar 6, 2019 - 10 comments

Markus Mohr commented on Mar 6, 2019

KoolReport 3.25.4

I have the following code:

<div class="row2"><div class="btn-warning2">Körpergewicht bei Erstuntersuchung</div></div>
<div class="row">
<div class="col-sm-6">
<!-- <div class="report-content"> -->
<!-- <div style="margin-bottom:50px;"> -->
<!-- <div class="col-md-12"> -->
    <?php
    ColumnChart::create(array(
        "title"=>"Körpergewicht bei Erstuntersuchung",
        "dataSource"=>(
            $this->src("patient")->query("
                SELECT floor(ini.BMIGewicht/15)*15 as agerange, count(*) as 'Gewichtswerte'
    			FROM dat_patient p
    			-- LEFT JOIN dat_optherapie op ON op.patID = p.ID
                LEFT JOIN dat_initialdaten ini ON ini.patID = p.ID
                WHERE 1 = 1
    			-- AND op.OP1Datum BETWEEN '1950-01-01' AND '2050-12-31'
    			AND (ini.BMIGewicht IS NOT NULL AND ini.BMIGewicht != -1)
    			-- AND op.patID = ini.patID
				-- AND NOT EXISTS (SELECT 1
				                  -- FROM dat_optherapie op2
				                  -- WHERE op2.patID = p.ID AND op2.revision > op.revision
				                 -- )
				AND NOT EXISTS (SELECT 1
				                  FROM dat_initialdaten ini2
				                  WHERE ini2.patID = p.ID AND ini2.revision > ini.revision
				                 )
				AND p.Testzwecke = 0
                GROUP BY agerange
            ")
            ->pipe(new CalculatedColumn(array(
                "agerange"=>array(
                    "exp"=>function($row)
                    {
                        return $row["agerange"]."-".($row["agerange"]+15);
                    },
                    "type"=>"string"
                )
            )))
        ),
	    "options"=>array(
	        "vAxis"=>array(
	            "title"=>"Anzahl an Patienten",
	        ),
	        "hAxis"=>array(
	            "title"=>"Gewichtswerte"
	        )
	    )
	));
    ?>
</div>
<div class="col-sm-6">
<!-- <div style="margin-bottom:50px;"> -->
<!-- <div class="col-md-12"> -->
    <?php
    ColumnChart::create(array(
        "title"=>"Körpergewicht vor Erstoperation",
        "dataSource"=>(
            $this->src("patient")->query("
                SELECT floor(op.OP1Gewicht/15)*15 as agerange, count(*) as 'Gewichtswerte'
    			FROM dat_patient p
    			LEFT JOIN dat_optherapie op ON op.patID = p.ID
                -- LEFT JOIN dat_initialdaten ini ON ini.patID = p.ID
                WHERE 1 = 1
    			-- AND op.OP1Datum BETWEEN '1950-01-01' AND '2050-12-31'
    			AND (op.OP1Gewicht IS NOT NULL AND op.OP1Gewicht != -1)
    			-- AND op.patID = ini.patID
				AND NOT EXISTS (SELECT 1
				                  FROM dat_optherapie op2
				                  WHERE op2.patID = p.ID AND op2.revision > op.revision
				                 )
				-- AND NOT EXISTS (SELECT 1
				                  -- FROM dat_initialdaten ini2
				                  -- WHERE ini2.patID = p.ID AND ini2.revision > ini.revision
				                 -- )
				AND p.Testzwecke = 0
                GROUP BY agerange
            ")
            ->pipe(new CalculatedColumn(array(
                "agerange"=>array(
                    "exp"=>function($row)
                    {
                        return $row["agerange"]."-".($row["agerange"]+15);
                    },
                    "type"=>"string"
                )
            )))
        ),
	    "options"=>array(
	        "vAxis"=>array(
	            "title"=>"Anzahl an Patienten",
	        ),
	        "hAxis"=>array(
	            "title"=>"Gewichtswerte"
	        )
	    )
	));
    ?>
</div>
</div>
<!-- </div> -->

With the current div settings they nicely sit side by side as charts:

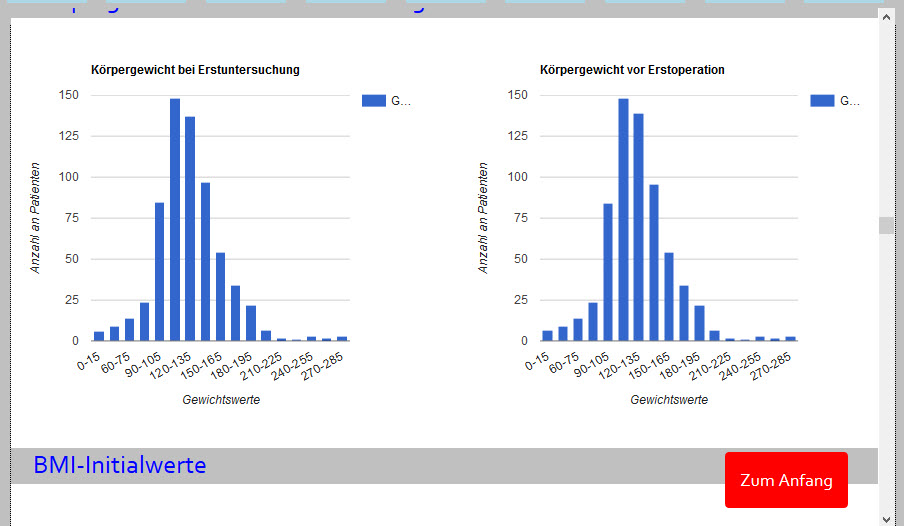
(Right: They display the same values, since this contains just sample data.)

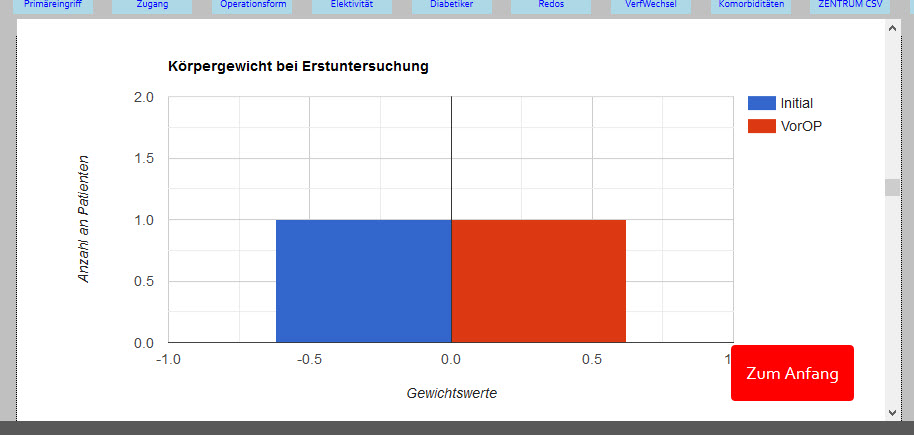
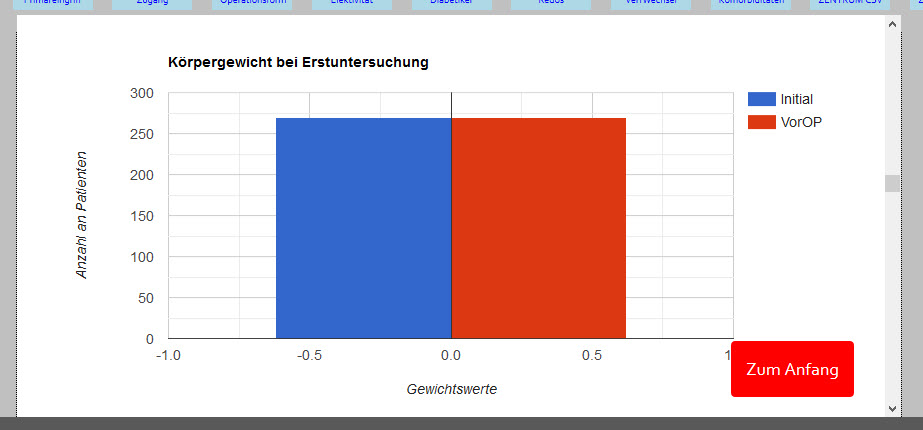
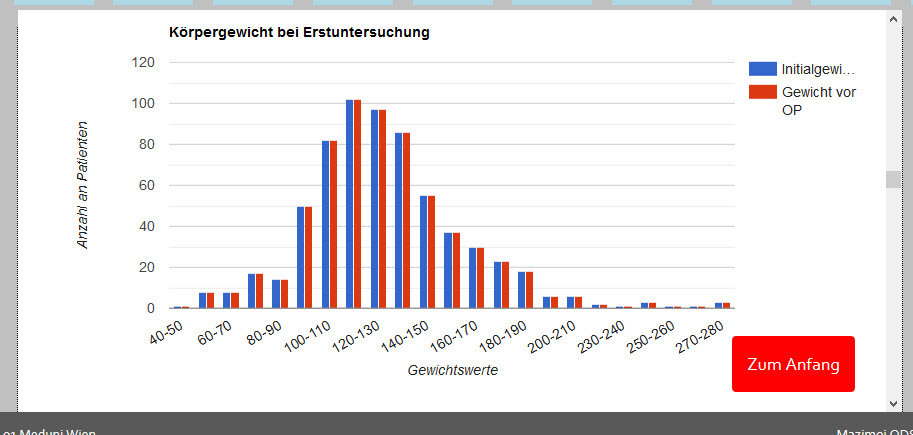
But how can I produce only ONE single chart in which the columns are side by side discerned by color? The example in the documentation concerning ColumnChart does not help me here ...

KoolReport commented on Mar 7, 2019

Let try following query

                SELECT floor(op.OP1Gewicht/15)*15 as agerange, count(*) as 'Gewichtswerte', count(*) as 'Another'
    			FROM dat_patient p
    			LEFT JOIN dat_optherapie op ON op.patID = p.ID
                -- LEFT JOIN dat_initialdaten ini ON ini.patID = p.ID
                WHERE 1 = 1
    			-- AND op.OP1Datum BETWEEN '1950-01-01' AND '2050-12-31'
    			AND (op.OP1Gewicht IS NOT NULL AND op.OP1Gewicht != -1)
    			-- AND op.patID = ini.patID
				AND NOT EXISTS (SELECT 1
				                  FROM dat_optherapie op2
				                  WHERE op2.patID = p.ID AND op2.revision > op.revision
				                 )
				-- AND NOT EXISTS (SELECT 1
				                  -- FROM dat_initialdaten ini2
				                  -- WHERE ini2.patID = p.ID AND ini2.revision > ini.revision
				                 -- )
				AND p.Testzwecke = 0
                GROUP BY agerange

You will see what you want. Of course two columns on each agerange will have the same value but will be different color. So next step you will replace the "Another" column with your real data.

Markus Mohr commented on Mar 7, 2019

Would the following SQL query be an option then?

SELECT
count(FLOOR(ini.BMIGewicht/15)*15) AS 'Initial',
count(FLOOR(op.OP1Gewicht/15)*15) AS 'VorOP'
FROM dat_patient p
LEFT JOIN dat_initialdaten ini ON ini.patID = p.ID
LEFT JOIN dat_optherapie op ON op.patID = p.ID
WHERE 1 = 1
AND ini.patID = op.patID
AND op.OP1Datum BETWEEN '1950-01-01' AND '2050-12-31'
-- AND (ini.BMIGewicht IS NOT NULL AND ini.BMIGewicht != -1)
AND NOT EXISTS (
SELECT 1
FROM dat_optherapie op2
WHERE op2.patID = p.ID AND op2.revision > op.revision
)
AND NOT EXISTS (
SELECT 1
FROM dat_initialdaten ini2
WHERE ini2.patID = p.ID AND ini2.revision > ini.revision
)
AND p.Testzwecke = 0
-- GROUP BY Initial

Markus Mohr commented on Mar 9, 2019

I have tested the following:

<div class="row2"><div class="btn-warning2">Körpergewicht bei Erstuntersuchung</div></div>
<div class="col-md-12">
    <?php
    ColumnChart::create(array(
        "title"=>"Körpergewicht bei Erstuntersuchung",
        "dataSource"=>(
            $this->src("patient")->query("
				SELECT
				count(FLOOR(ini.BMIGewicht/15)*15) AS 'Initial',
				count(FLOOR(op.OP1Gewicht/15)*15) AS 'VorOP'
				FROM dat_patient p
				LEFT JOIN dat_initialdaten ini ON ini.patID = p.ID
				LEFT JOIN dat_optherapie op ON op.patID = p.ID
				WHERE 1 = 1
				AND ini.patID = op.patID
				AND op.OP1Datum BETWEEN '1950-01-01' AND '2050-12-31'
				AND (ini.BMIGewicht IS NOT NULL AND ini.BMIGewicht != -1)
				AND (op.OP1Gewicht IS NOT NULL AND op.OP1Gewicht != -1)
				AND NOT EXISTS (
				SELECT 1
				FROM dat_optherapie op2
				WHERE op2.patID = p.ID AND op2.revision > op.revision
				)
				AND NOT EXISTS (
				SELECT 1
				FROM dat_initialdaten ini2
				WHERE ini2.patID = p.ID AND ini2.revision > ini.revision
				)
				AND p.Testzwecke = 0
				-- GROUP BY Initial
            ")
            ->pipe(new CalculatedColumn(array(
                "Initial"=>array(
                    "exp"=>function($row)
                    {
                        return $row["Initial"]."-".($row["Initial"]+15);
                    },
                    "type"=>"number"
                ),
                "VorOP"=>array(
                    "exp"=>function($row)
                    {
                        return $row["VorOP"]."-".($row["VorOP"]+15);
                    },
                    "type"=>"number"
                )
            )))
        ),
	    "options"=>array(
	        "vAxis"=>array(
	            "title"=>"Anzahl an Patienten",
	        ),
	        "hAxis"=>array(
	            "title"=>"Gewichtswerte"
	        )
	    )
	));
    ?>
</div>

There is no option to make this work.

The result looks like:

I simply do not get it as how to handle two columns side by side.

Can anyone help, please?

KoolReport commented on Mar 9, 2019

If your query return data with 3 (three) fields category, data1, data2, your chart will show two columns on each category. In your above query, you only have 2 fields.

Markus Mohr commented on Mar 9, 2019

Sorry, this is way too abstract.

In my code, there are two counted variables / fields: "Initial" and "VopOP" as individual count functions of two JOINed tables within one database. A category might be the PatientID since it is the same for both tables. So, I could group according to the p.ID variable / field.

But now, I need to put in the p.ID, for example defining it as "PatientID", into the "->pipe" area?

Markus Mohr commented on Mar 9, 2019

Okay, I modified the code according to that:

<div class="row2"><div class="btn-warning2">Körpergewicht bei Erstuntersuchung</div></div>
<div class="col-md-12">
    <?php
    ColumnChart::create(array(
        "title"=>"Körpergewicht bei Erstuntersuchung",
        "dataSource"=>(
            $this->src("patient")->query("
				SELECT
				p.ID AS 'PatientID',
				count(FLOOR(ini.BMIGewicht/15)*15) AS 'Initial',
				count(FLOOR(op.OP1Gewicht/15)*15) AS 'VorOP'
				FROM dat_patient p
				LEFT JOIN dat_initialdaten ini ON ini.patID = p.ID
				LEFT JOIN dat_optherapie op ON op.patID = p.ID
				WHERE 1 = 1
				AND ini.patID = op.patID
				AND op.OP1Datum BETWEEN '1950-01-01' AND '2050-12-31'
				AND (ini.BMIGewicht IS NOT NULL AND ini.BMIGewicht != -1)
				AND (op.OP1Gewicht IS NOT NULL AND op.OP1Gewicht != -1)
				AND NOT EXISTS (
				SELECT 1
				FROM dat_optherapie op2
				WHERE op2.patID = p.ID AND op2.revision > op.revision
				)
				AND NOT EXISTS (
				SELECT 1
				FROM dat_initialdaten ini2
				WHERE ini2.patID = p.ID AND ini2.revision > ini.revision
				)
				AND p.Testzwecke = 0
				GROUP BY PatientID
            ")
            ->pipe(new CalculatedColumn(array(
                "Initial"=>array(
                    "exp"=>function($row)
                    {
                        return $row["Initial"]."-".($row["Initial"]+15);
                    },
                    "type"=>"number"
                ),
                "VorOP"=>array(
                    "exp"=>function($row)
                    {
                        return $row["VorOP"]."-".($row["VorOP"]+15);
                    },
                    "type"=>"number"
                ),
                "PatientID"=>array(
					"label"=>"patientID",
                    "type"=>"number"
                )
            )))
        ),
	    "options"=>array(
	        "vAxis"=>array(
	            "title"=>"Anzahl an Patienten",
	        ),
	        "hAxis"=>array(
	            "title"=>"Gewichtswerte"
	        )
	    )
	));
    ?>
</div>

The result of that is the following chart:

So: why are there no separate histograms with proper counting? It is clear to me that it either has got to do with the SQL query per se or with the declaration within the ->pipe.

What is it?

Markus Mohr commented on Mar 9, 2019

No, it does not work, whatever I do:

<div class="row2"><div class="btn-warning2">Körpergewicht bei Erstuntersuchung</div></div>
<div class="col-md-12">
    <?php
    ColumnChart::create(array(
        "title"=>"Körpergewicht bei Erstuntersuchung",
        "dataSource"=>(
            $this->src("patient")->query("
				SELECT
				p.ID AS 'PatientID',
				IFNULL(sum(FLOOR(ini.BMIGewicht/15)*15), 'Noch nicht dokumentiert') AS 'Initial',
				IFNULL(sum(FLOOR(op.OP1Gewicht/15)*15), 'Noch nicht dokumentiert') AS 'VorOP'
				FROM dat_patient p
				LEFT JOIN dat_initialdaten ini ON ini.patID = p.ID
				LEFT JOIN dat_optherapie op ON op.patID = p.ID
				WHERE 1 = 1
				AND ini.patID = op.patID
				AND op.OP1Datum BETWEEN '1950-01-01' AND '2050-12-31'
				AND (ini.BMIGewicht IS NOT NULL AND ini.BMIGewicht != -1)
				AND (op.OP1Gewicht IS NOT NULL AND op.OP1Gewicht != -1)
				AND NOT EXISTS (
				SELECT 1
				FROM dat_optherapie op2
				WHERE op2.patID = p.ID AND op2.revision > op.revision
				)
				AND NOT EXISTS (
				SELECT 1
				FROM dat_initialdaten ini2
				WHERE ini2.patID = p.ID AND ini2.revision > ini.revision
				)
				AND p.Testzwecke = 0
				GROUP BY PatientID
            ")
            ->pipe(new CalculatedColumn(array(
                "Initial"=>array(
                    "exp"=>function($row)
                    {
                        return $row["Initial"]."-".($row["Initial"]+15);
                    },
                    "type"=>"number"
                ),
                "VorOP"=>array(
                    "exp"=>function($row)
                    {
                        return $row["VorOP"]."-".($row["VorOP"]+15);
                    },
                    "type"=>"number"
                ),
                "PatientID"=>array(
					"label"=>"patientID",
                    "type"=>"number"
                )
            )))
        ),
	    "options"=>array(
	        "vAxis"=>array(
	            "title"=>"Anzahl an Patienten",
	        ),
	        "hAxis"=>array(
	            "title"=>"Gewichtswerte"
	        )
	    )
	));
    ?>
</div>

Result:

What shall I do?

KoolReport commented on Mar 10, 2019

Good, now your chart has two columns already. And you understand that your first field in your query will be used as xaxis value and the subsequent fields will be used as data. Now it just matter of query data. Your first field should be the agerange ( which is also the key to join your two separate queries) and another two field is result from each query . as long as you have following data from your query, everything will work

agerangemetric1metric2
03422
154432
305054
453340

Above data are just sample.

Markus Mohr commented on Mar 10, 2019

I am sorry but I do not see the analogy to "agerange" here. My query consists of two distinct queries using either "count" or "sum", the "... AS 'Initial'" and "... AS 'VorOP'" are equivocal and each basically represent an "agerange" each.

But the queries need to be GROUPed: ... GROUP BY 'Initial', 'VorOP'.

Using the above query, however, excluding the PatientID merely results in the following error message:

"All series on a given axis must be of the same data type×".

Couldn't you be so nice as to correct my above query to what you think is the proper way to handle that?

Markus Mohr commented on Mar 10, 2019

The correct SQL query code for this is:

<div class="row2"><div class="btn-warning2">Körpergewicht Erstuntersuchung vs. unmittelbar präoperativ</div></div>
<div class="col-md-12">
    <?php
    ColumnChart::create(array(
        "title"=>"Körpergewicht bei Erstuntersuchung vs. unmittelbar präoperativ",
        "dataSource"=>(
            $this->src("patient")->query("
				SELECT
				IFNULL(FLOOR(ini.BMIGewicht/10)*10, 1000) AS agerange,
				count(IFNULL(FLOOR(ini.BMIGewicht/10)*10, 1000)) AS Initialgewicht,
				count(IFNULL(FLOOR(op.OP1Gewicht/10)*10, 1000)) AS 'Gewicht vor OP'
				FROM dat_patient p
				LEFT JOIN dat_initialdaten ini ON ini.patID = p.ID
				LEFT JOIN dat_optherapie op ON op.patID = p.ID
				WHERE 1 = 1
				AND ini.patID = op.patID
				AND op.OP1Datum BETWEEN '1950-01-01' AND '2050-12-31'
				-- AND ini.BMIGewicht IS NOT NULL  -- no need since IFNULLed
				AND ini.BMIGewicht != -1
				AND ini.BMIGewicht != 0
				-- AND op.OP1Gewicht IS NOT NULL  -- no need since IFNULLed
				AND op.OP1Gewicht != -1
				AND op.OP1Gewicht != 0
				AND NOT EXISTS (
				SELECT 1
				FROM dat_optherapie op2
				WHERE op2.patID = p.ID AND op2.revision > op.revision
				)
				AND NOT EXISTS (
				SELECT 1
				FROM dat_initialdaten ini2
				WHERE ini2.patID = p.ID AND ini2.revision > ini.revision
				)
				AND p.Testzwecke = 0
				GROUP BY agerange
            ")
            ->pipe(new CalculatedColumn(array(
	            "agerange"=>array(
					"label"=>"Körpergewicht",
	                "exp"=>function($row)
	                {
	                    if ($row["agerange"] == 1000)
	                    {
	                        $row["agerange"] = "Noch nicht dokumentiert";
	                        return $row["agerange"];
	                    }
	                    else
	                    {
	                        return $row["agerange"]."-".($row["agerange"]+10);
	                    }
	                },
	                "type"=>"string"
				))))
	    ),
	    "options"=>array(
	        "vAxis"=>array(
	            "title"=>"Anzahl an Patienten",
	        ),
	        "hAxis"=>array(
	            "title"=>"Gewichtswerte"
	        )
	    )
    ));
    ?>
</div>

This results in the following graph (the values of blue and red are with one single exception the same, so this is not an issue):

Herein ...

IFNULL(FLOOR(ini.BMIGewicht/10)*10, 1000) AS agerange,

is nothing else than responsible for the x axis,

count(IFNULL(FLOOR(ini.BMIGewicht/10)*10, 1000)) AS Initialgewicht,

is the first set of data (blue) and

count(IFNULL(FLOOR(op.OP1Gewicht/10)*10, 1000)) AS 'Gewicht vor OP'

is the second set of data (red).

Note: Whatever shall be displayed has to be packed into one single query, i. e. the first IFNULL SQL query cannot be written as "IFNULL(...), count('Initialgewicht')" since that would result in TWO different columns and not in ONE.

Build Your Excellent Data Report

Let KoolReport help you to make great reports. It's free & open-source released under MIT license.

Download KoolReport View demo
help needed
solved

None