KoolReport's Forum
Official Support Area, Q&As, Discussions, Suggestions and Bug reports.
Forum's Guidelines
Table header to table data #69
Open zenon opened this topic on on Aug 10, 2017 - 12 comments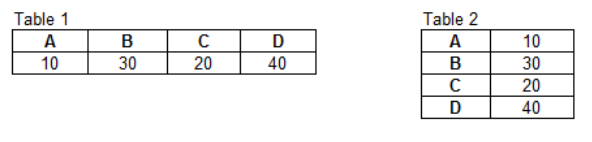
Hi,
Can the transpose process work after selecting the column I want from the original table?
<?php
        Table::create(array(
        "dataStore"=>$this->dataStore('report'),
        "columns"=>array(
            "a"=>array("decimals"=>2),
            "b"=>array("decimals"=>2),
            "c"=>array("decimals"=>2),
            "d"=>array("decimals"=>2)
            ),
        "cssClass"=>array(
            "table"=>"table table-bordered table-condensed",
        ),

        "removeDuplicate"=>array("a", "b", "c", "d")
    ));
?>
I want to transpose the output from the above code.
Could this be possible?
Hi,
My data is stored in this way: name, category, description, ratey1, ratey2, ratey3
I need a Table report to look like this:
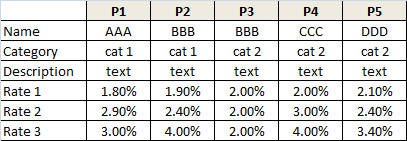
I suppose I can use Transpose process in the setup() function to switch my data to column, and store in datastore. I am not able display the transposed data somehow. How do I define the report columns so as to display the transposed data?
Hi,
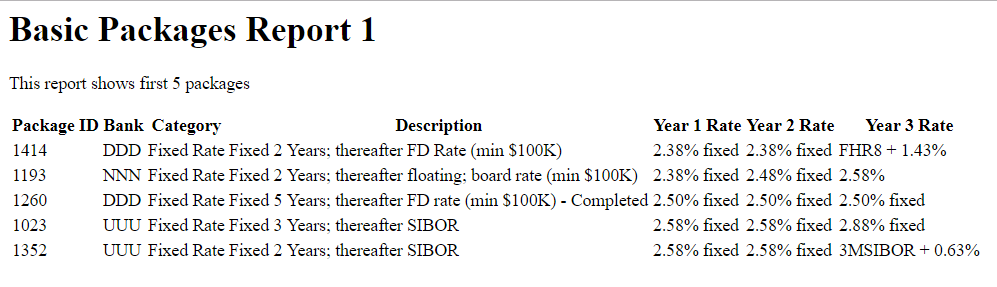
Report 1 is without Transpose process.
Report 2 is with Transpose process.
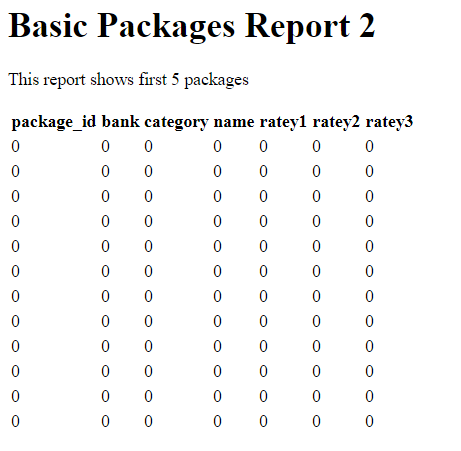
The php codes for the 2 Reports are exactly the same, except the Transpose() process was added for Report 2. I am trying to figure out how to define the Columns for the Table display.
Here is the php code:with Transpose process:
    protected function setup()
    {
        $this->src('packages')
        ->pipe(new Filter(array(
			array("category","=","Fixed Rate"),
			array("activeflag","=","Y"),
        )))
        ->pipe(new Sort(array(
            "ratey1"=>"asc",
			"ratey2"=>"asc",
			"ratey3"=>"asc",
        )))
        ->pipe(new Limit(array(5)))
        ->pipe(new Transpose())
	->pipe($this->dataStore('basic_dataout'));
    }
Here is the php code for displaying the Table:
<?php
	Table::create(array(
        "dataStore"=>$this->dataStore('basic_dataout'),
            "columns"=>array(
                "package_id"=>array(
                    "label"=>"Package ID"
                ),
                "bank"=>array(
                    "label"=>"Bank"
                ),
                "category"=>array(
                    "label"=>"Category"
				),
				"name"=>array(
                    "label"=>"Description"
                ),
				"ratey1"=>array(
                    "label"=>"Year 1 Rate"
                ),
				"ratey2"=>array(
                    "label"=>"Year 2 Rate"
                ),
				"ratey3"=>array(
                    "label"=>"Year 3 Rate"
                ),
            ),
        "cssClass"=>array(
            "table"=>"table table-hover table-bordered"
        )
    ));
?>
Thank you
Hi,
Please allow me to re-phrase my question.
My data in csv file looks like this:
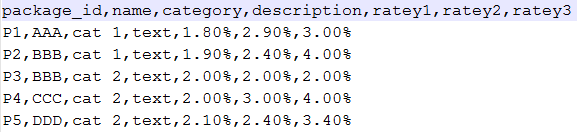
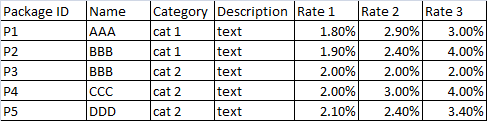
Using kookreport, I am able to output a report (Table) that looks like this:
My question is how can I output a report (Table) that looks as follows. Instead of rows, the records are output in columns.
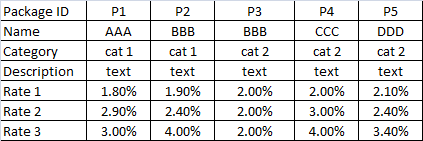
Thank you
Build Your Excellent Data Report
Let KoolReport help you to make great reports. It's free & open-source released under MIT license.
Download KoolReport View demo