KoolReport's Forum

Official Support Area, Q&As, Discussions, Suggestions and Bug reports.
Forum's Guidelines

Tutorial Problems #602

Closed Jonathan Long opened this topic on on Jan 22, 2019 - 6 comments

Jonathan Long commented on Jan 22, 2019

I don't know if I am going crazy ...

I initially downloaded the free version of KR to try to do some line charts, only to realize that the chartjs package was in the paid version. Thinking that this is why I couldn't get the chartjs demo to work locally, I paid for the pro version to get all the packages. I copied and pasted the script per the examples for the chartjs line, making an adjustment to the autoload path. I also enabled error reporting and I was getting a blank page.

I decided to try the tutorial, and I was able to get part of the Tutorial 1 to load ... but this is what I see:

The Div layer with the text describing the table doesn't show up in the source code, so it isn't being processed. I also don't see the first table appearing either.

I'm not experienced enough with PHP to try to debug this (nor do I have the time or energy to do that).

Suggestions?

I'd like to work through the tutorials to better understand this, but, with errors like this, it will be difficult to understand and tweak with the code to understand how to works.
KoolReport commented on Jan 22, 2019

Could you please check the report filename, report classname and the prefix of the view file. They should be the same. For example: the filename is MyReport.php containing the MyReport class and the view file is MyReport.view.php.

KoolReport commented on Jan 22, 2019

Could you please check the report filename, report classname and the prefix of the view file. They should be the same. For example: the filename is MyReport.php containing the MyReport class and the view file is MyReport.view.php.

Jonathan Long commented on Jan 22, 2019

Hello - Thanks for the reply.

I have no idea what I did, but somehow I managed to get it working.

Now that I have it kind of working, maybe you can help with another topic.

I want to do a series chart that represents the number of items an employee has worked on.

  • X Axis is date/time
  • Y Axis is Quantity

Each line/series represents an employee.

My data is formatted as:

| DateTime | User ID | Quantity |

This table is a view of a table named 'stats'. The view groups the data by timestamp and userid, then counts the record id as the quantity.

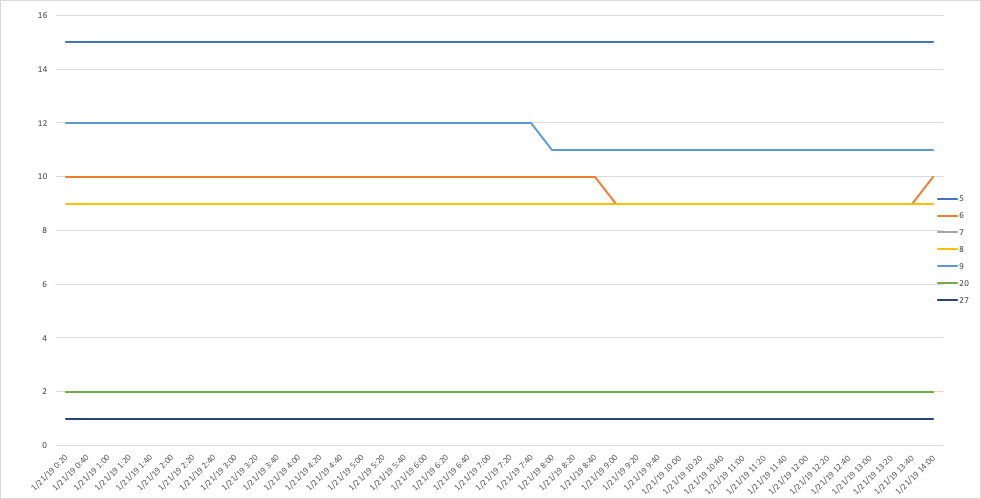
Here is an example of the graph I am trying to duplicate:

This is the code I have so far ... which gives me a very basic graph (with no data obviously)

LineChart::create(array(

'dataSource'=>$this->dataStore("grouped_stats"),
'columns'=>array(
    'reportTimestamp'=>array(
        'label'=>'Timestamp',
        'type'=>'datetime')

Looking at the example, it seems like I need to create a column for each user. However, I want this list to be dynamic (as we may add, or remove users at another point in time).

I am thinking that I need to create a more complex query (that obtains a list of all the users), then use a looping query to obtain the results for each user and store that to an array that would pass to the report.

Can you confirm if there is a better way to achieve this type of result?

KoolReport commented on Jan 23, 2019

You need to use the Cube process to turn your table into format

Time56720
1/1/201912222
1/1/201912222

in which the row first column is time, the column 5 6 7 20 is actually the ids of your user

KoolReport commented on Jan 23, 2019

You need to use the Cube process to turn your table into format

Time56720
1/1/201912222
1/1/201912222

in which the row first column is time, the column 5 6 7 20 is actually the ids of your user

Jonathan Long commented on Jan 24, 2019

Thank you very much - you've given me a lot of pointers in the right direction.

Much appreciated!

Build Your Excellent Data Report

Let KoolReport help you to make great reports. It's free & open-source released under MIT license.

Download KoolReport View demo
None yet

None