I'm checking this example: https://www.koolreport.com/docs/google_charts/column_chart/
But I can't wrap my head around how I can convert MySQL Query to this format:
"dataSource"=>array(
    array("category"=>"Books","sale"=>32000,"color"=>"#4F5060"),
    array("category"=>"Accessories","sale"=>43000,"color"=>"#67819D"),
    array("category"=>"Phones","sale"=>54000,"color"=>"#ADBD37"),
    array("category"=>"Movies","sale"=>23000,"color"=>"#588133",),
    array("category"=>"Others","sale"=>12000,"color"=>"#003B45"),
),
I tried to fiddle around with Transpose, but that didn't get me so far.
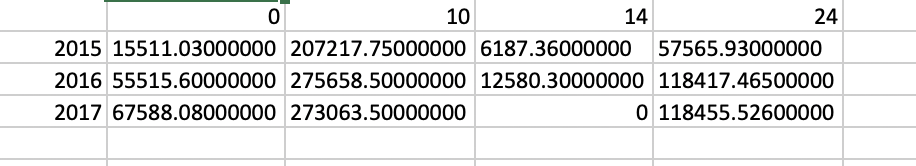
Also tried to use Cube:
  ->pipe(new Cube(array(
                            "row" => "year",
                            "column" => "vat",
                            "sum" => "sale_amount"
                        )))
But it doesn't group into years for some reason when using the ColumnChart.
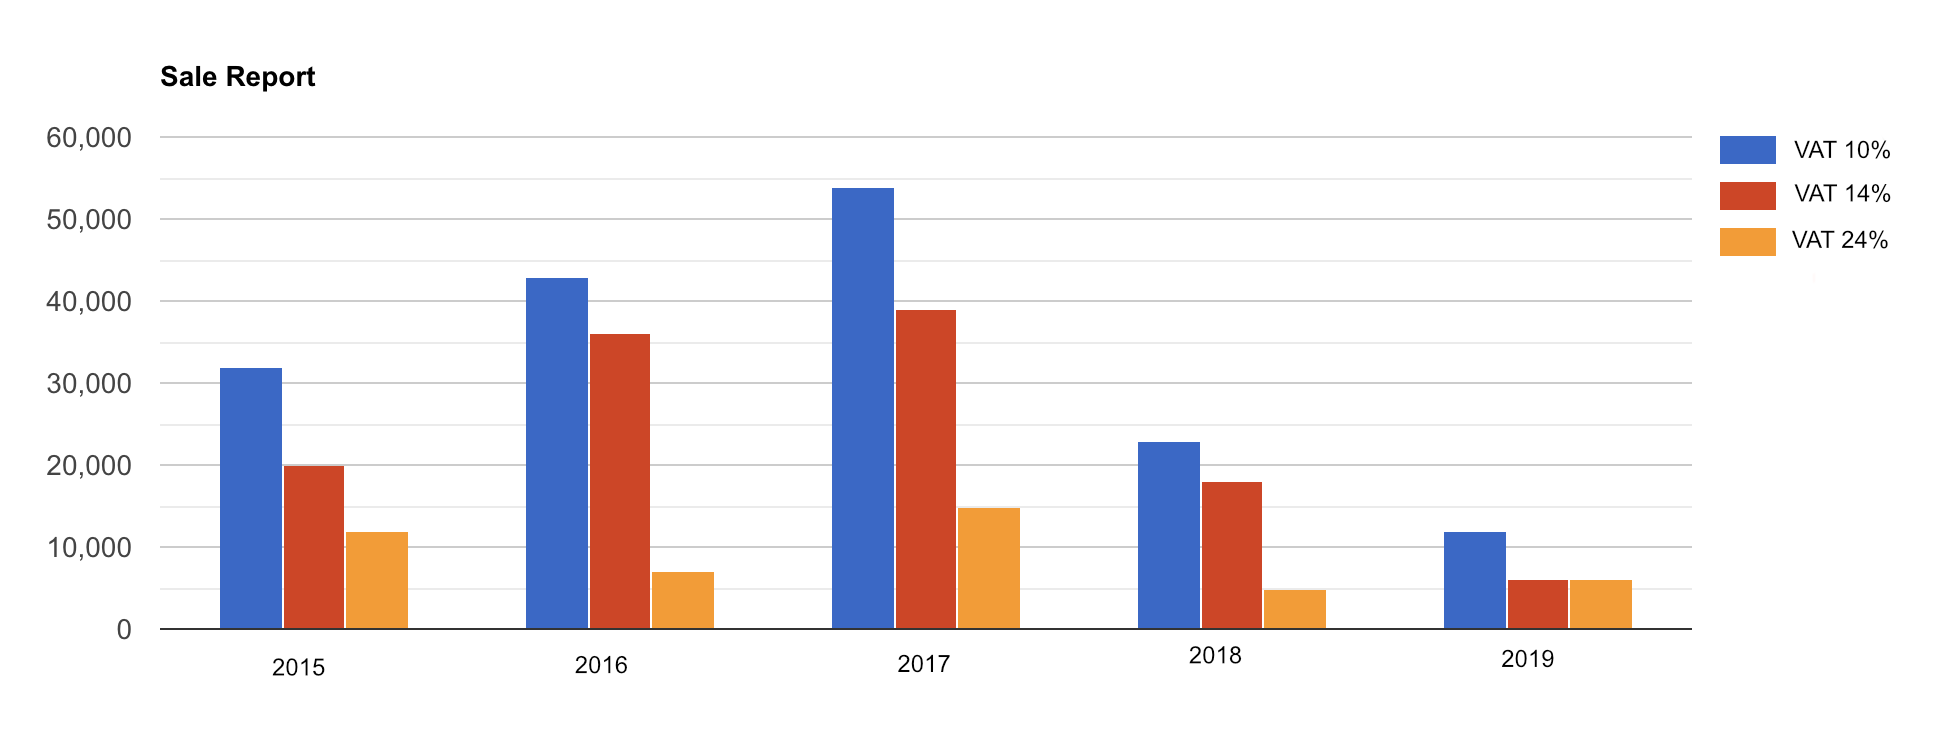
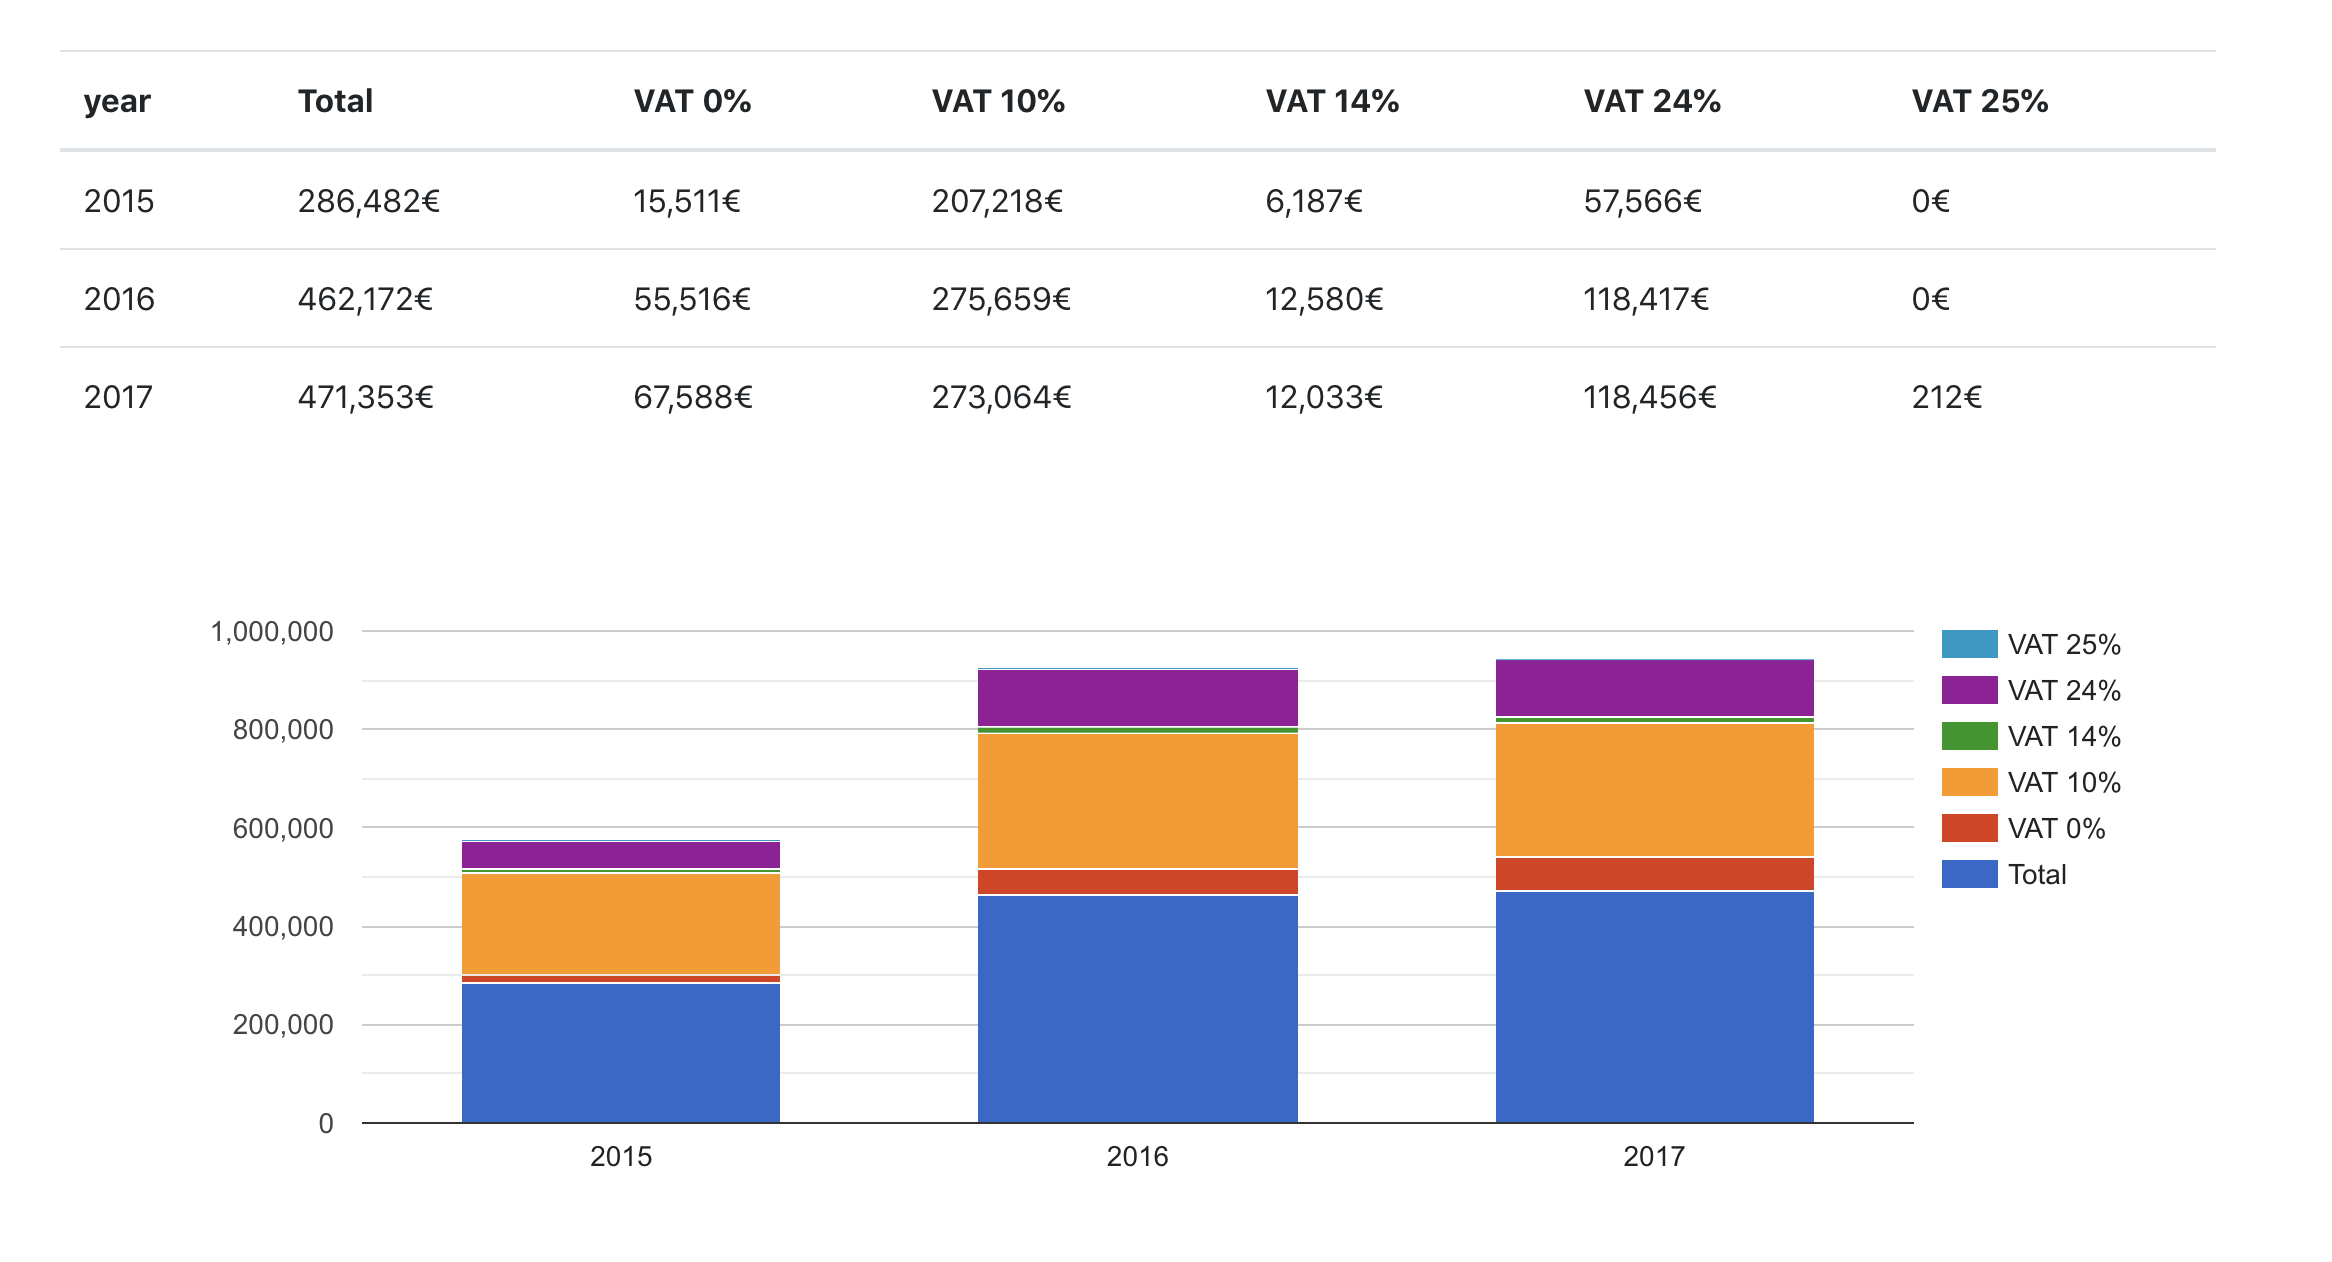
What I'm basically trying to do is to show yearly stats of sales which VAT as grouping.
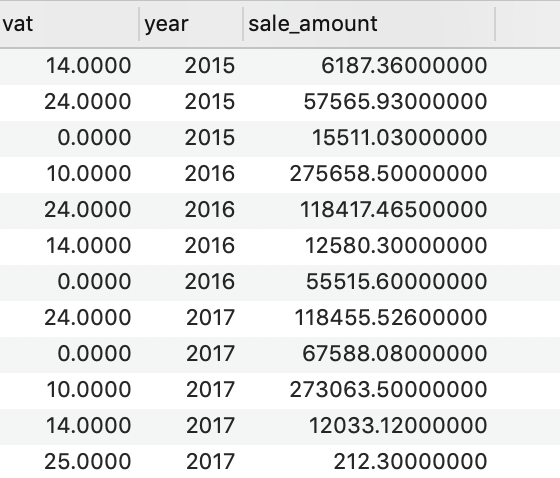
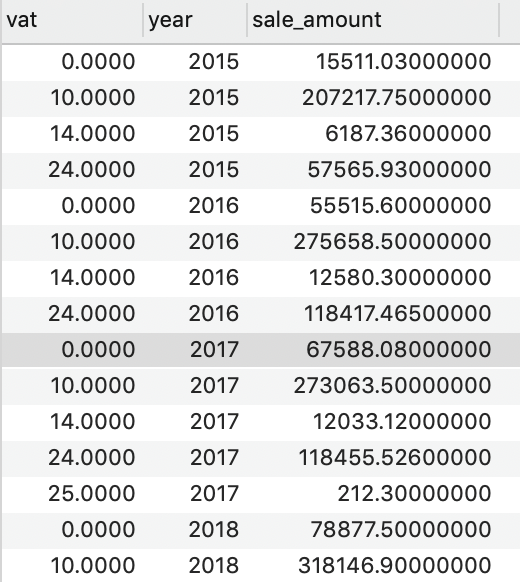
 SELECT rr.vat,YEAR(r.tstamp) as year,sum(amount*price) as sale_amount
                            FROM receipts r, receipt_row rr
                            where rr.receipt_id = r.id
                            GROUP BY year,rr.vat
This gives me
vat	year	sale_amount
10.0000	2015	207217.75000000
14.0000	2015	6187.36000000
24.0000	2015	57565.93000000
0.0000	2015	15511.03000000
10.0000	2016	275658.50000000
24.0000	2016	118417.46500000
14.0000	2016	12580.30000000
0.0000	2016	55515.60000000
And I don't have an idea how to get it to the right format for the ColumnChart. This is what I'm aiming for with the cube.