KoolReport's Forum

Official Support Area, Q&As, Discussions, Suggestions and Bug reports.
Forum's Guidelines

Need to know about chartjs #450

Open mike opened this topic on on Sep 7, 2018 - 24 comments

mike commented on Sep 7, 2018

Hi support team,

I'm developing linecharts and I have come across some charts example which on internet ... I just want to know is there any options we can same with koolreport charts ...

please find below image which I got from internet ...

KoolReport commented on Sep 7, 2018

Yes, it can be done with koolreport either google charts or chartjs. What exactly the feature in above chart example that you are looking for?

mike commented on Sep 7, 2018

Thanks for response ..

the charts is date between sale quantities of tickets....

when we hover on particular date its should shows all ticket's quantities ( like mention in above image ) respective date .....

KoolReport commented on Sep 7, 2018

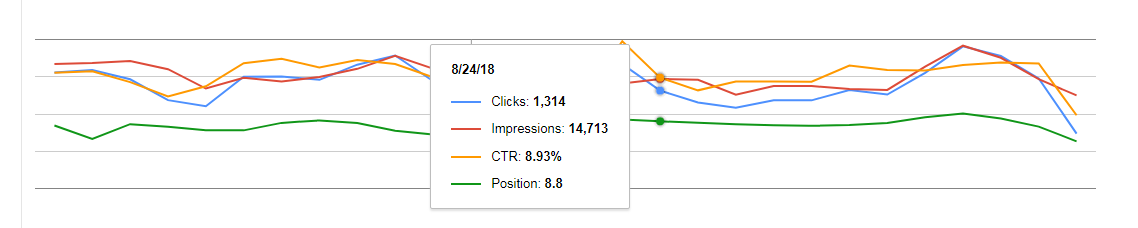
Please go to chartjs example, you go to the last example which you can see everytime you hover the group of column, it will shows the tooltips with all values. You can change to use the Linechart only with x-axis is the date.

Here is the settings:

...
"options"=>array(
    "tooltips"=>array(
        "mode"=>"index",
        "intersect"=>true,
    )
)
...
mike commented on Sep 7, 2018

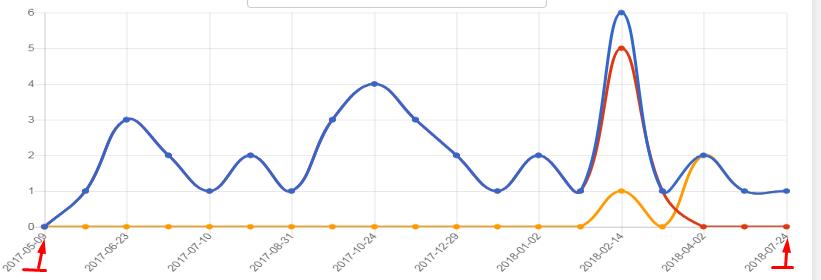
Yes , I saw in example ... i set this code on my charts but it doesn't work ....

     LineChart::create(array(
                "dataStore"=>$this->dataStore('new_report'),  

    "width"=>"100%",
      "options"=>array(
			"responsive"=>true,
			"legend"=>array(
			"position"=>"bottom",
			),
			'pointShape' => 'circle',
			'pointSize' => 5,
			 "scales"=>array(
        "xAxes"=>array(
		"tooltips"=>array(
			"mode"=>"index",
			"intersect"=>true,
		),
          )
    ),
							
					),
	"cssClass"=>array(
					"legend"=>"csslegend",
			)

));

KoolReport commented on Sep 7, 2018

The "tooltips" should be under "options", not the "xAxes"

mike commented on Sep 7, 2018

ok I tried with that also

          LineChart::create(array(
	                "dataStore"=>$this->dataStore('new_report'),  
	
	    "width"=>"100%",
          "options"=>array(
		  "legend"=>array(
				"position"=>"bottom",
				),
				"tooltips"=>array(
					"mode"=>"index",
					"intersect"=>true,
			),				
						),
		
));
KoolReport commented on Sep 7, 2018

It is directly inside "options", right now it is inside "legend" :(

mike commented on Sep 7, 2018

but its still not working .... wts going wrong here..

LineChart::create(array(

                "dataStore"=>$this->dataStore('new_report'),  

    "width"=>"100%",
      "options"=>array(
		"tooltips"=>array(
				"mode"=>"index",
				"intersect"=>true,
		),	
		
						
					),
	

));

KoolReport commented on Sep 7, 2018

Our whole code for the example is:

<?php
LineChart::create(array(
    "title"=>"Sale Report",
    "dataSource"=>$category_amount,
    "columns"=>array(
        "category",
        "sale"=>array(
            "label"=>"Sale",
            "type"=>"number",
            "prefix"=>"$"
        ),
        "cost"=>array(
            "label"=>"Cost",
            "type"=>"number",
            "prefix"=>"$"
        ),
        "profit"=>array(
            "label"=>"Profit",
            "type"=>"number",
            "prefix"=>"$",
        ),
    ),
    "options"=>array(
        "tooltips"=>array(
            "mode"=>"index",
            "intersect"=>true,
        )
    )
));
?>
mike commented on Sep 7, 2018

is it necessary to provide columns array ??

KoolReport commented on Sep 7, 2018

No it is not

mike commented on Sep 7, 2018

LineChart::create(array(

"dataSource"=>$this->dataStore('new_report'), 

"options"=>array(
    "tooltips"=>array(
        "mode"=>"index",
        "intersect"=>true,
    )
)

));

not working ....

KoolReport commented on Sep 7, 2018

May be your try to use "columns" to manually add column to see how. Also make sure that you are using the latest version of chartjs package or KoolReport Pro. Please let me know.

mike commented on Sep 7, 2018

we are using # Version 2.43.0 ..

KoolReport commented on Sep 7, 2018

The latest is 2.78.0

mike commented on Sep 7, 2018

so it doesn't support # Version 2.43.0 ..??????

what could we do to get latest version ..
KoolReport commented on Sep 7, 2018

Could you please upgrade to 2.78.0, everything will be fine.

mike commented on Sep 7, 2018

How to upgrade it , we have already purchased it ...

KoolReport commented on Sep 7, 2018

There is ONE(1) Year of Free Upgrade subscription with your license, you can just login and download the latest one, replacing the old one with new one.

mike commented on Sep 7, 2018

Ok we try this

mike commented on Sep 7, 2018

Its, working now, Thank you for all your help

mike commented on Sep 7, 2018

Could you please let me know how to work with

'showTextEvery' 
in chartJs ....

because it's not supporting ...

KoolReport commented on Sep 8, 2018

Could you please explain further?

mike commented on Sep 11, 2018

Hi support team, I want hide middle date on xaxis of line chartjs .......

like we can do with google charts using below codes ..

'showTextEvery' =>number_of_lables-1,

i want to know how to do with charts js 

(show only start date and end date )

Build Your Excellent Data Report

Let KoolReport help you to make great reports. It's free & open-source released under MIT license.

Download KoolReport View demo
None yet

None