KoolReport's Forum

Official Support Area, Q&As, Discussions, Suggestions and Bug reports.
Forum's Guidelines

How to reduce column width in chartjs column chart #445

Open sneha narnaware opened this topic on on Sep 4, 2018 - 2 comments

sneha narnaware commented on Sep 4, 2018

hi support team,

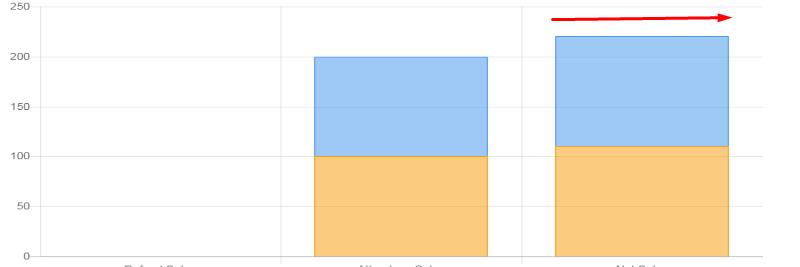
I'm using chartjs/column chart...

how to set each column width ......

ColumnChart::create(array(
        "dataStore"=>$this->dataStore('report_byNet'),
        "width"=>"100%",
	    "stacked"=>true,
       "columns"=>array(
				"name"=>array(  
				),
				"usd_total"=>array(
				    "type"=>"number",
				),
				"cad_total"=>array(
				  "type"=>"number",
				),
                        "Total"=>array(
				    "type"=>"number",
					),
			),
		 "options"=>array(
          	"legend"=>array(
			"position"=> 'bottom',
			),
			"chartArea"=>array(
			"width"=>"80%",
			'top'=>10,
			),
		'vAxis' => array(
			'textStyle' => array(
				'fontSize' => 11 
			),
			),
			'hAxis' => array(
			'textStyle' => array(
				'fontSize' => 11 
			),
			),
			"annotations"=>array(
			    "alwaysOutside"=>true,
				'textStyle' => array(
				'fontSize' => 11 
			),
			),
			
        ),
		"colorScheme"=>array("#f79a00","#ea3f45", "#3d92ee")
    ));
KoolReport commented on Sep 5, 2018

Sorry for my late reply, you can set the barThickness in ChartJs options:

ColumnChart::create(array(
    "options"=>array(
        "barThickness"=>100
    )
))

The barThickness is specified in pixel. For more detail, please look at our documentation.

sneha narnaware commented on Sep 6, 2018

thanks, I have tried with all options its its not applying it ...

ColumnChart::create(array(
    "dataStore"=>$this->dataStore('report_byNet'),
    "width"=>"100%",
   // "height"=>"300px",
   "columns"=>array(
			"name"=>array(
			    
			),
			"usd_total"=>array(
			    "type"=>"number",
				"prefix" => "$",
				),
			"cad_total"=>array(
			  "type"=>"number",
			  "prefix" => "$",
				),
			"Total"=>array(
			    "type"=>"number",
				"prefix" => "$",
				),
		),
		
	  "stacked"=>true,
	 "options"=>array(
	
		  "barThickness"=>10,
	 "maxBarThickness"=>10,
	 "categoryPercentage"=>0.2,
	 "barPercentage"=>0.2,
      
		"legend"=>array(
		"position"=> 'bottom',
		),
		"chartArea"=>array(
		"width"=>"80%",
		'top'=>10,
		),
		
    ),
	"colorScheme"=>array("#f79a00","#ea3f45", "#3d92ee")
));

Build Your Excellent Data Report

Let KoolReport help you to make great reports. It's free & open-source released under MIT license.

Download KoolReport View demo
solved

None