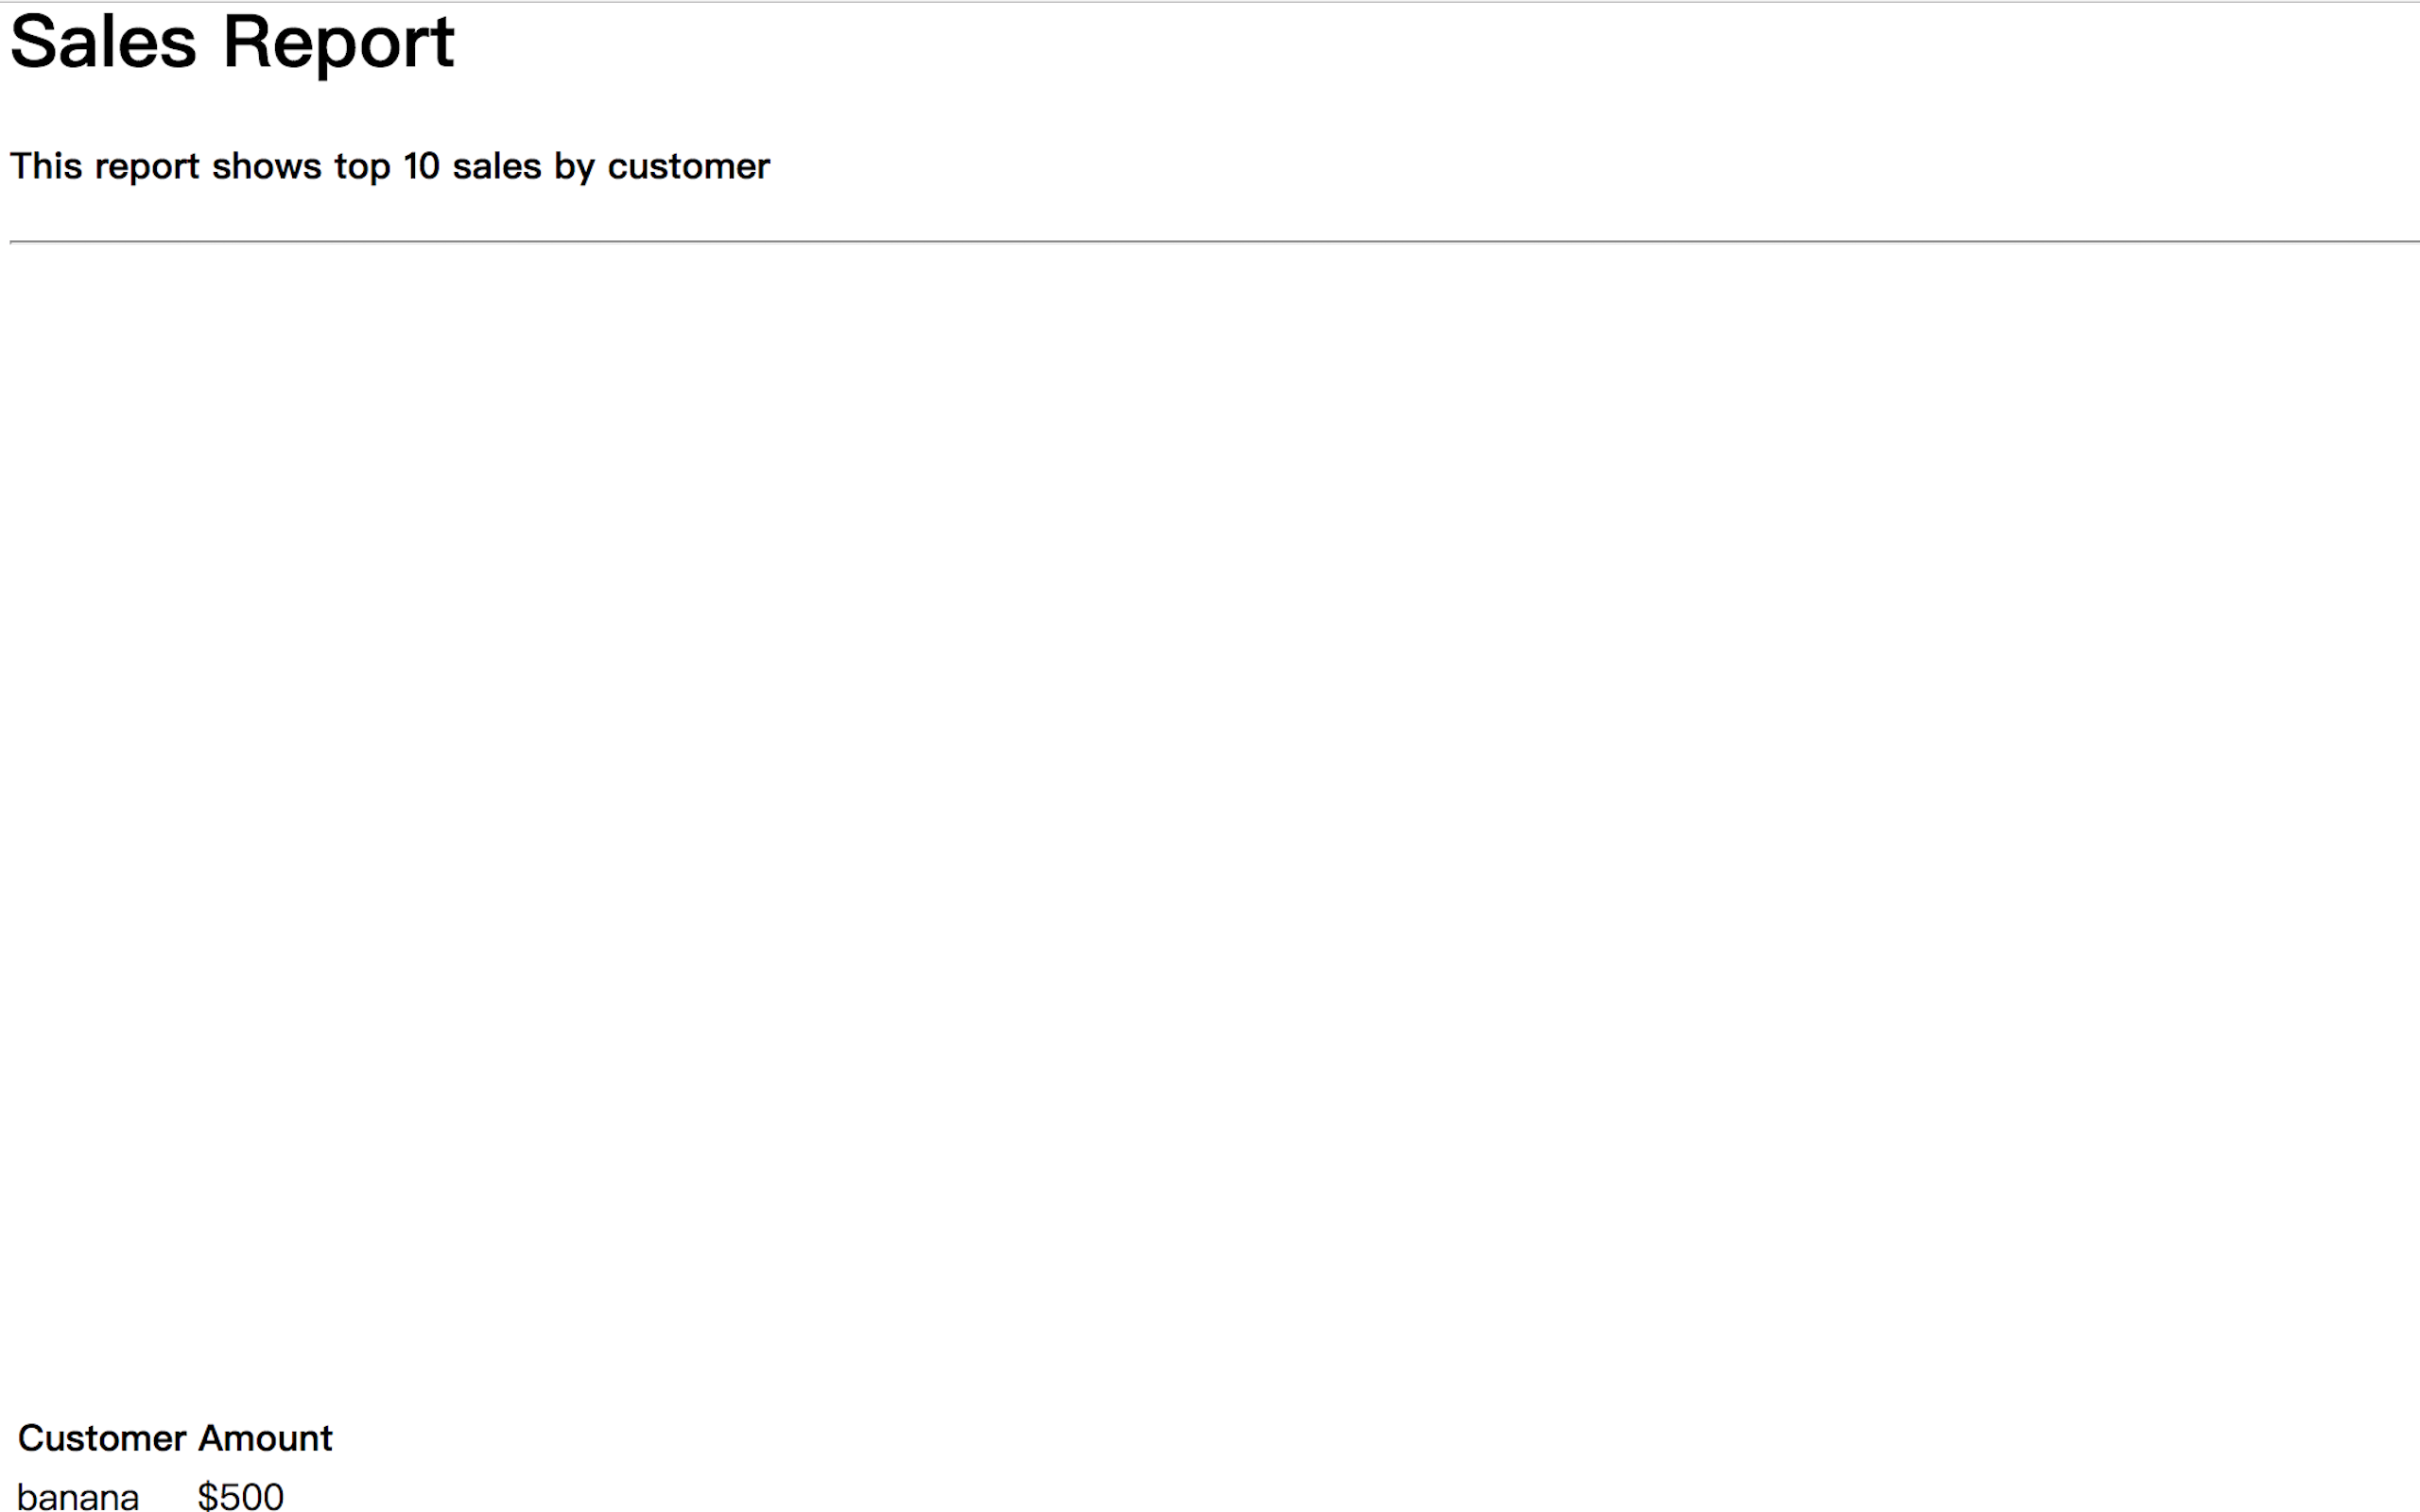
hi,I followed the example to make my first report but the chart , table.css , table.js seem not to work.here what it look like.

MyReport.view.php
<?php
use \koolreport\widgets\koolphp\Table;
use \koolreport\widgets\google\BarChart;
?>
Sales Report
This report shows top 10 sales by customer
<?php
BarChart::create(array(
    "dataStore"=>$this->dataStore('sales_by_customer'),
    "width"=>"100%",
    "height"=>"500px",
    "columns"=>array(
        "Name"=>array(
            "label"=>"Customer"
        ),
        "dollar"=>array(
            "type"=>"number",
            "label"=>"Amount",
            "prefix"=>"$",
        )
    ),
    "options"=>array(
        "title"=>"Sales By Customer"
    )
));
?>
<?php Table::create(array(
"dataStore"=>$this->dataStore('sales_by_customer'),
    "columns"=>array(
        "Name"=>array(
            "label"=>"Customer"
        ),
        "dollar"=>array(
            "type"=>"number",
            "label"=>"Amount",
            "prefix"=>"$",
        )
    ),
"cssClass"=>array(
    "table"=>"table table-hover table-bordered"
)
)); ?>