Hi Arthur,
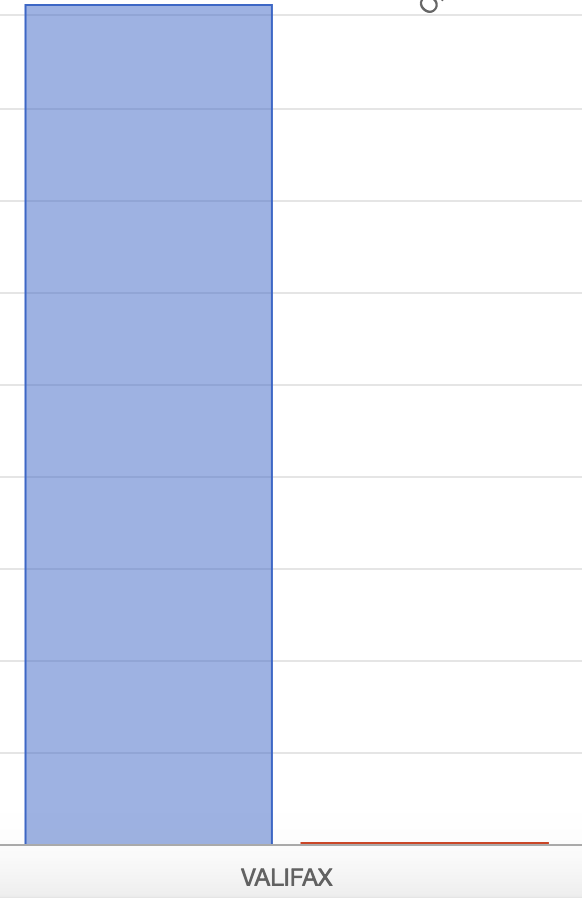
Thanks for your email. We've checked your chart page and it seems that you forgot to include options.scales together with columns. Please try the following code to see how it goes:
ColumnChart::create(array(
	"title"=>"Sale Report",
	"dataStore"=>$this->dataStore('PO'),
	"columns"=>array(
		"salesPerson",
		"PO"=>array(
			"type"=>"number",
			"label"=>"PO Marge Annuelle",
			"config"=>array(
				"yAxisID"=>"y-axis-1",
			)
		),
		 "Qte"=>array(
			"type"=>"number",
			"label"=>"Qte",
			"config"=>array(
				"yAxisID"=>"y-axis-2",
			)
		),
	),
	"options"=>array(
            "scales"=>array(
            "yAxes"=>array(
                array(
                    "id"=>"y-axis-1",
                    "type"=>"logarithmic",
                    "position"=>"left",
                    "display"=>true,
                ),
                array(
                    "id"=>"y-axis-2",
                    "type"=>"linear",
                    "position"=>"right",
                    "display"=>true,
                ),
            )
        )
    )
));
For various types of scale for your columns, please check this link:
https://www.chartjs.org/docs/latest/axes/cartesian/
Thanks!
