KoolReport's Forum

Official Support Area, Q&As, Discussions, Suggestions and Bug reports.
Forum's Guidelines

Marker GeoCharts? #397

Open Jure Zakrajsek opened this topic on on Jul 27, 2018 - 7 comments

Jure Zakrajsek commented on Jul 27, 2018

Hi

Is it posible to creat a google GeoChart based on latitude, longitude, population list to display circles of different size based on the location given?

An example from google: https://developers.google.com/chart/interactive/docs/gallery/geochart#marker-geocharts

Thx

Jure

KoolReport commented on Jul 27, 2018

Sure you can do so, here is the sample code

GeoChart::create(array(
    "dataSource"=>$this->dataStore("mydata"),
    "columns"=>array("city","population","area"),
    "options"=>array(
        "region"=>"IT",
        "displayMode"=>"markers",
        "colorAxis"=>array(
            "colors"=>array("green","blue")
        )
    )
));
Jure Zakrajsek commented on Jul 27, 2018

Wow that was easy :) Thx

KoolReport commented on Jul 27, 2018

You are welcome :)

bysystem commented on Jan 15, 2019

Dear support team,

similar to the issue above I tried to create a geochart with markers like in the example from google above.

But unfortunately I get a blank page!

Could you please tell me what I'm doing wrong?

Here is my population2019.csv:

city;   population; area;
Rome;      2761477;    1285.31;
Milan;     1324110;    181.76;
Naples;    959574;     117.27;
Turin;     907563;     130.17;
Palermo;   655875;     158.9;
Genoa;     607906;     243.60;
Bologna;   380181;     140.7;
Florence;  371282;     102.41;
Fiumicino; 67370;      213.44;
Anzio;     52192;      43.43;
Ciampino;  38262;      11;

Here is my index.php

<?php
	
error_reporting(1);
require_once "autorepgeochart.php";
$autorepgeochart = new autorepgeochart;
$autorepgeochart->run();
?> 

<!DOCTYPE >
<html>
  <head>
    <meta http-equiv="X-UA-Compatible" content="IE=edge" />
    <title>AutoRep: GeoChart</title>
	<link rel="shortcut icon" href="favicon.ico">
	<link rel="stylesheet" href="../autorep.css" />
  </head>
  <body>  

	<div id="main">
		<?php $autorepgeochart->render();?>
	</div>
  </body>
</html>

Here is my autorepgeochart.php:

<?php

require_once "../koolreport/autoload.php";
use \koolreport\processes\Filter;
use \koolreport\processes\ColumnMeta;
use \koolreport\pivot\processes\Pivot;
use \koolreport\processes\Group;
use \koolreport\processes\Sort;
use \koolreport\processes\Limit;
use \koolreport\processes\Custom;
use \koolreport\cube\processes\Cube;
use \koolreport\cube\processes\RemoveColumn;
use \koolreport\cleandata\FillNull;

class autorepgeochart extends koolreport\KoolReport
{
    protected function settings()
    {
        return array(
            "dataSources"=>array(
                "population2019"=>array(
                    "class"=>'\koolreport\datasources\CSVDataSource',
                    'filePath'=>dirname(__FILE__)."population2019.csv",
                    "fieldSeparator"=>";"
                )
            )
        );
    }

    protected function setup()
    {
        $this->src("population2019")
        ->pipe($this->dataStore("population2019"));
    }
}

And here is my autorepgeochart.view.php:

<?php

	use \koolreport\pivot\widgets\PivotTable;
	use \koolreport\widgets\koolphp\Table;
	use \koolreport\inputs\MultiSelect;
	use \koolreport\inputs\Select2;
	use \koolreport\inputs\CheckBoxList;
	use \koolreport\inputs\RadioList;
	use \koolreport\inputs\DateTimePicker;
	use \koolreport\widgets\google\BarChart;
	use \koolreport\widgets\google\PieChart;
	use \koolreport\widgets\google\ComboChart;
	use \koolreport\widgets\google\ColumnChart;
	use \koolreport\widgets\google\LineChart;
	use \koolreport\widgets\google\Chart;
	use \koolreport\widgets\google\GeoChart;
	use \koolreport\widgets\google;

?>

	<div id="col1">
		<div class="report-container">
			<div class="text-center">
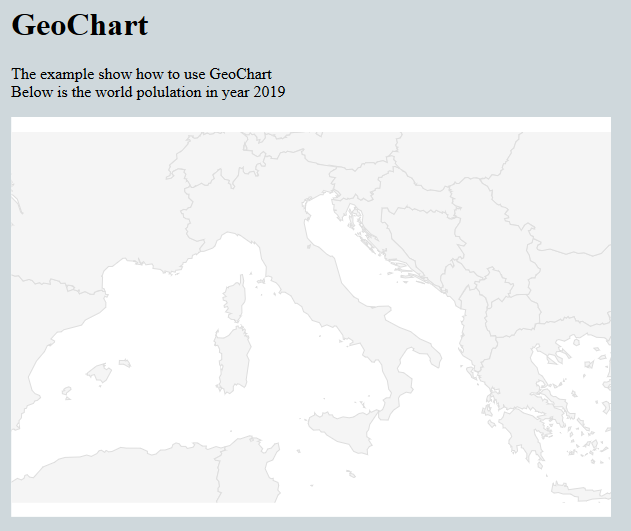
				<h1>GeoChart</h1>
				<p class="lead">
					The example show how to use GeoChart <br/> Below is the world polulation in year 2019
				</p>
			</div>

			<div style="margin-bottom:50px;">
			<?php
				GeoChart::create(array(
					"dataSource"=>$this->dataStore("population2019"),
					"columns"=>array("city","population","area"),
					"options"=>array(
						"region"=>"IT",
						"displayMode"=>"markers",
						"colorAxis"=>array(
							"colors"=>array("green","blue")
						)
					)
				));
			?>
			</div>
		</div>
	</div>	
	
  </body>
</html>

Thx a lot in advance for your hint!

Kind regards, bysystem
KoolReport commented on Jan 15, 2019

Hi Yilmaz,

Long time no see.

Please try to do this:

'filePath'=>dirname(__FILE__)."/population2019.csv",

You may miss the / slash. Let me know if it works

bysystem commented on Jan 15, 2019

Dear support team,

I am now 1 step further ;-)

I've corrected my csv file as follows:

city;population;area
Rome;2761477;1285.31
Milan;1324110;181.76
Naples;959574;117.27
Turin;907563;130.17
Palermo;655875;158.9
Genoa;607906;243.60
Bologna;380181;140.7
Florence;371282;102.41
Fiumicino;67370;213.44
Anzio;52192;43.43
Ciampino;38262;11

In autorepgeochart.php I've changed the function from protected to public and adjusted the filePath:

    public function settings()
    {
        return array(
            "dataSources"=>array(
                "population2019"=>array(
                    "class"=>'\koolreport\datasources\CSVDataSource',
                    //'filePath'=>dirname(__FILE__)."population2019.csv",
					"filePath"=>"population2019.csv",
                    "fieldSeparator"=>";"
                ),
            )
        );
    }

    public function setup()
    {
        $this->src("population2019")
        ->pipe($this->dataStore("population2019"));
    }

In autorepgeochart.view.php: --> If I use 3 columns then I get an error message "Incompatible data table: Error: Table contains more columns than expected (Expecting 2 columns)"! --> If I use only 2 columns like: "columns"=>array("city", "population"),

--> I get only the map but without markers etc. (see below)

			<?php
				GeoChart::create(array(
					"dataSource"=>$this->dataStore("population2019"),
					//"columns"=>array("city","population","area"),
					"columns"=>array("city", "population"),
					"options"=>array(
						"region"=>"IT",
						"displayMode"=>"markers",
						"colorAxis"=>array(
							"colors"=>array("green","blue")
						)
					)
				));
			?>

bysystem commented on Jan 17, 2019

Dear support team,

yes indeed, long time busy with other projects ;-) But again back to this great app koolreport!

Wish you all the best in 2019!

Do you have any hint related to the geochart problem described before?

Kind regards, Yilmaz

Build Your Excellent Data Report

Let KoolReport help you to make great reports. It's free & open-source released under MIT license.

Download KoolReport View demo
solved

None