Hi support,
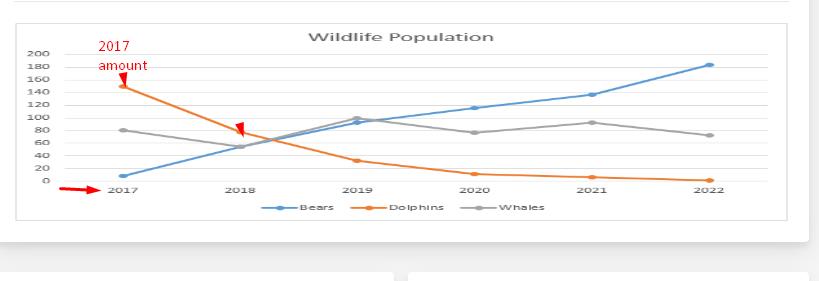
I am trying to hide x-axis values and show that value to top of the line chart intends of over on it
<?php
       AreaChart::create(array(
                "dataStore"=>$this->dataStore('together'),

	    "width"=>"100%",
		"options"=>array(
				"responsive"=>true,
				"legend"=>array(
				"position"=>"bottom",
				"style"=>"circle",
				)
				)
));
?>
I can't use columns array here because the column name keep change according to the data-Id is there any to do this .... and also I want to use legends circle style in areachart or line chart ........
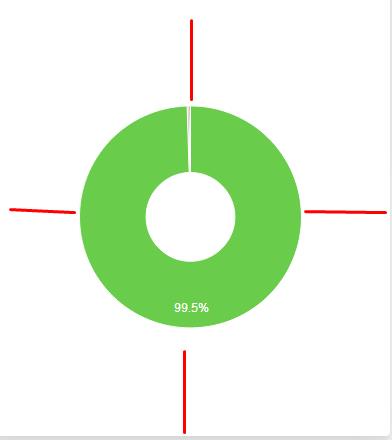
in pie chart its taking extra space top, bottom , left , right
<?php
       DonutChart::create(array(
                "dataStore"=>$this->dataStore('Total_Report'),
				"left"=>"0px",
                                 "top"=>"0px",
				"width"=>"100%",
     "options"=>array(
            "responsive"=>true,
			"legend"=>"none",
            ),
   "colorScheme"=>array("#69CD4B","#82A6E0","#d8c600",
   "#ED561B", "#0dd2e8", "#058DC7"),

));
?>