KoolReport's Forum

Official Support Area, Q&As, Discussions, Suggestions and Bug reports.
Forum's Guidelines

DrillDown - multiple datasets ChartJS #377

Open Jure Zakrajsek opened this topic on on Jul 17, 2018 - 13 comments

Jure Zakrajsek commented on Jul 17, 2018

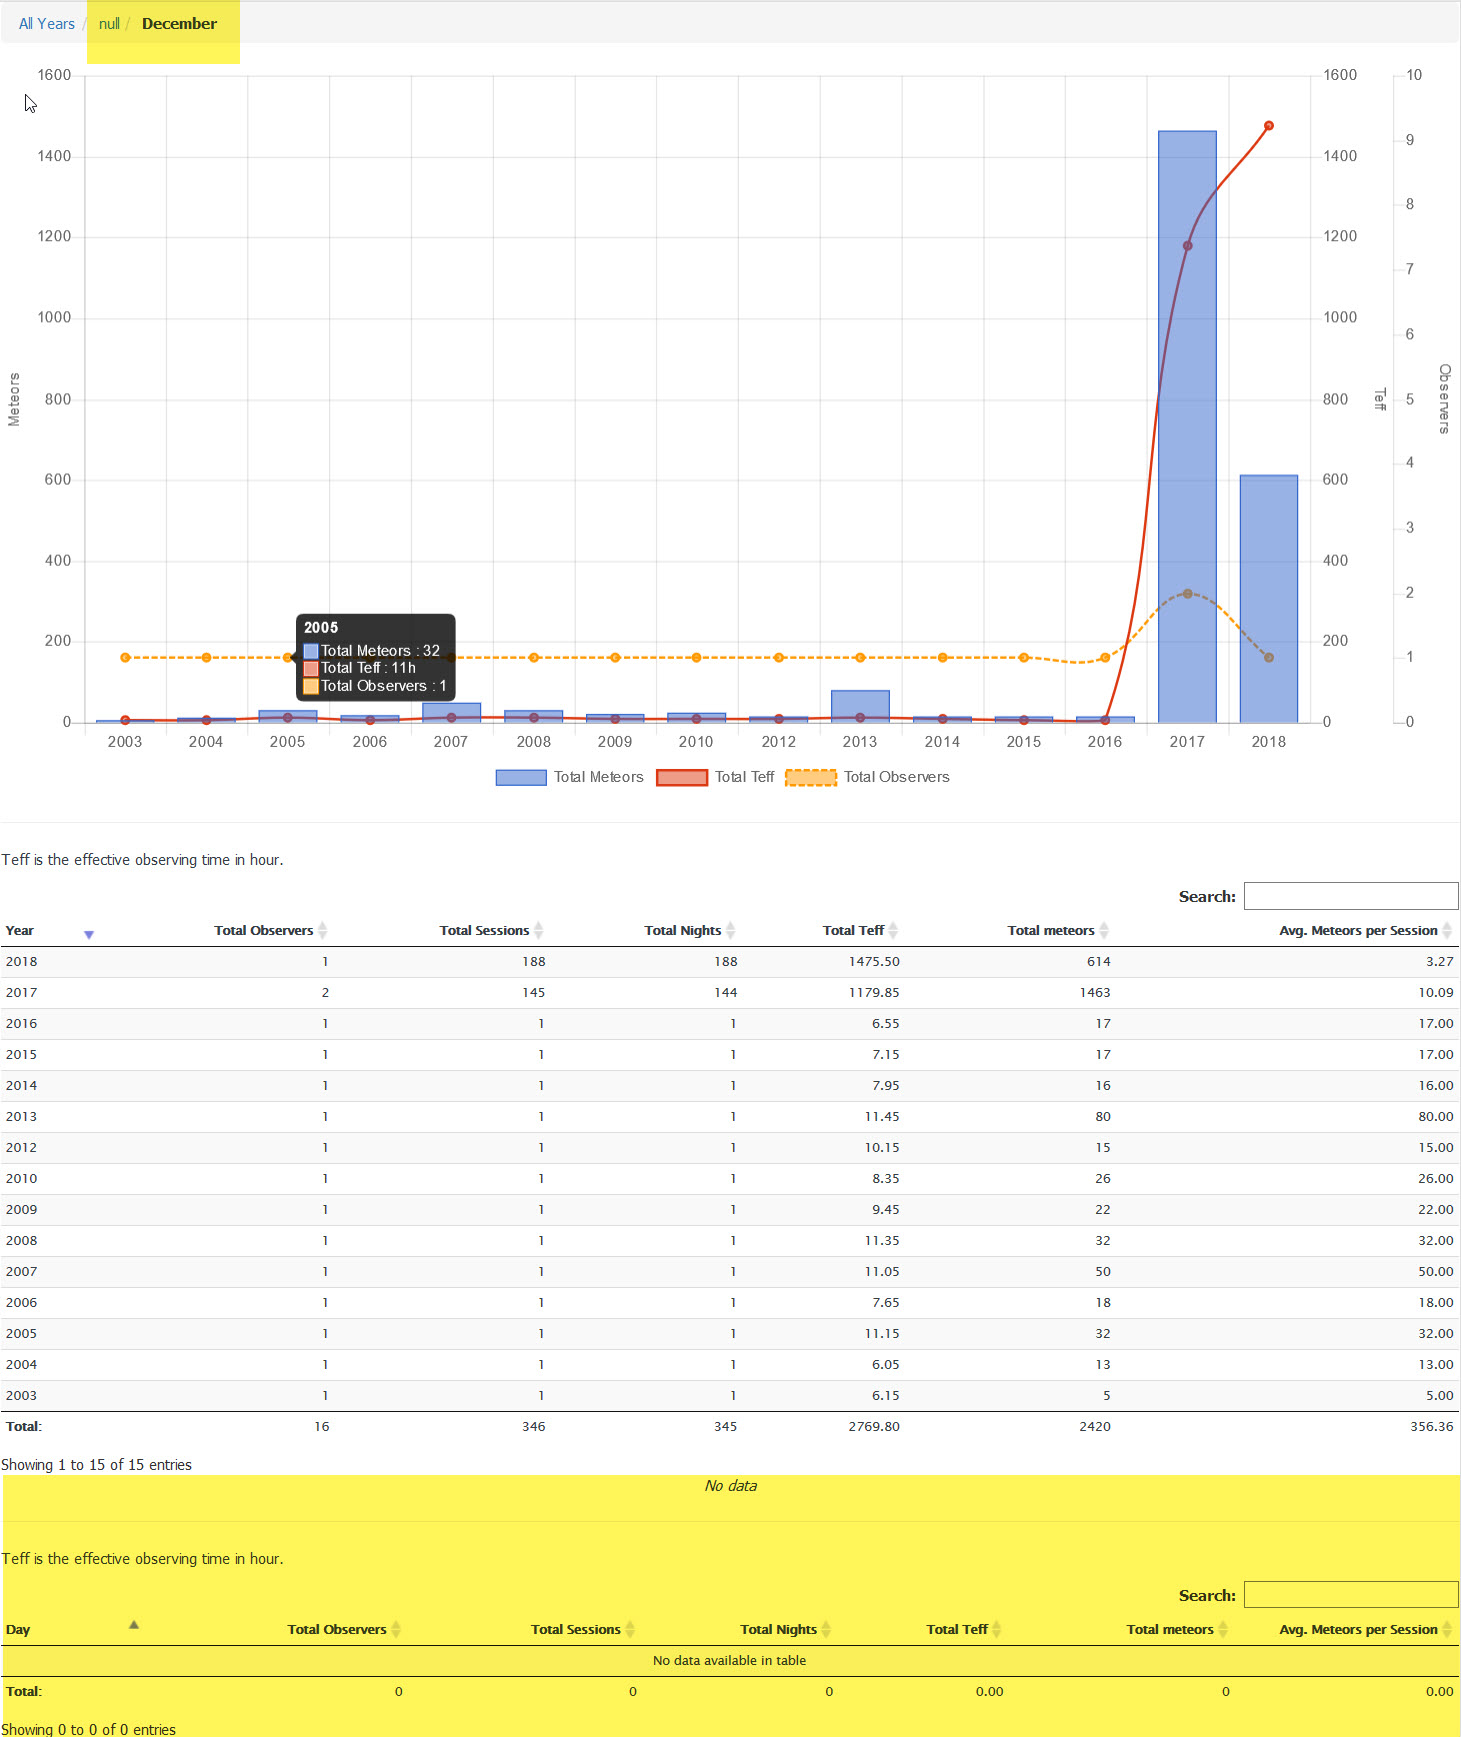
I have a problem with a CustomDrillDown report. If i put multiple datasets with multiple y-axes on my ColumnChart, the drilldown function seems to behave strange. Instead of going to the next level it gives a null to level1 and some value to level2 (in the example "December", i clicked on the 2018 column). The level1 report is displayed below the initial one and not rendered individualy.

This is my ColumnChart with 3 y-axix defined in the report.view.php scales option:

    ColumnChart::create(array(
        "title"=>"My report",
        "dataSource"=>$this->dataStore("report_sql"),
        "options"=>array(
        "responsive"=>true,
        "legend"=>array(
            "position"=>"bottom",
        ),
        "tooltips"=>array(
            "position"=>"nearest",
            "mode"=>"index",
            "intersect"=>false,
        ),		
        "scales"=>array(
            "xAxes"=>[array(
                "barPercentage"=>0.4,
            ),
            ],
            "yAxes"=>[array(
                "type"=>'linear',
                "display"=>true,
                "id"=>'y-axis-1',
                "position"=>'left',
                "scaleLabel"=>array(
                    "display"=>true,
                    "labelString"=>'Value1',
                ),
                "ticks"=>array(
                    "suggestedMin"=>0,
                    "suggestedMax"=>100,
                    "maxTicksLimit"=>9,
                ),
            ),
            array(
                "type"=>'linear',
                "display"=>true,
                "id"=>'y-axis-2',
                "position"=>'right',
                "scaleLabel"=>array(
                    "display"=>true,
                    "labelString"=>'Value2',
                ),
                "ticks"=>array(
                    "suggestedMin"=>0,
                    "suggestedMax"=>5,
                    "maxTicksLimit"=>9,
                ),
                "gridLines"=>array(
                    "drawOnChartArea"=>false,
                ),
            ),
            array(
                "type"=>'linear',
                "display"=>true,
                "id"=>'y-axis-3',				
                "position"=>'right',
                "scaleLabel"=>array(
                    "display"=>true,
                    "labelString"=>'Value3',
                ),				
                "ticks"=>array(
                    "suggestedMin"=>0,
                    "suggestedMax"=>100,
                    "maxTicksLimit"=>9,
                ),
                "gridLines"=>array(
                    "drawOnChartArea"=>false,
                ),
            ),
            ],
        ),
    ),
    "columns"=>array(
        "year",
        "value1"=>array(
            "label"=>"Value1",
            "type"=>"number",
            "suffix"=>"h",
            "config"=>array(
                "yAxisID"=>'y-axis-1',
            ),
        ),
        "value2"=>array(
            "label"=>"Value2", 	
            "type"=>"number",
            "config"=>array(
                "type"=>"line",
                "fill"=>false,
                "borderWidth"=>2,
                "yAxisID"=>'y-axis-3',
            )
        ),
        "value3"=>array(
            "label"=>"Value3",
            "type"=>"number",
            "config"=>array(
                "type"=>"line",
                "fill"=>false,
                "borderWidth"=>2,
                "borderDash"=>[5,2],
                "yAxisID"=>'y-axis-2',
            )
        ),
    ),
    "clientEvents"=>array(
        "itemSelect"=>"function(params){
            $drilldown.next({selected_year:params.selectedRow[0]});
        }",
    ),	
    "width"=>"100%",	
));

Help would be appreciated, thx.

Best regards Jure

KoolReport commented on Jul 17, 2018

I suggest that instead of use the $drilldown.next(), please use console.log(params) to see what params contain when you click the chart. Please open your Chrome inspect tool.

Jure Zakrajsek commented on Jul 17, 2018

Thx for the tip. If I print the params to the console I get the following. All three selects appear at one click.

{selectedValue: 1463, selectedRow: Array(4), selectedLabel: 2017, selectedRowIndex: 13, selectedColumnIndex: 1}
    selectedColumnIndex: 1
    selectedLabel: 2017
    selectedRow: (4) [2017, 1463, 1179.85, 2, obs_year: 2017, total_meteors: 1463, total_teff: 1179.85, total_observers: 2]
    selectedRowIndex: 13
    selectedValue: 1463
    __proto__: Object

{selectedValue: 1179.85, selectedRow: Array(4), selectedLabel: 2017, selectedRowIndex: 13, selectedColumnIndex: 2}
    selectedColumnIndex: 2
    selectedLabel: 2017   
    selectedRow: (4) [2017, 1463, 1179.85, 2, obs_year: 2017, total_meteors: 1463, total_teff: 1179.85, total_observers: 2]
    selectedRowIndex: 13
    selectedValue: 1179.85
    __proto__: Object

{selectedValue: 2, selectedRow: Array(4), selectedLabel: 2017, selectedRowIndex: 13, selectedColumnIndex: 3}
    selectedColumnIndex: 3
    selectedLabel: 2017
    selectedRow: (4) [2017, 1463, 1179.85, 2, obs_year: 2017, total_meteors: 1463, total_teff: 1179.85, total_observers: 2]
    selectedRowIndex: 13
    selectedValue: 2
    __proto__: Object

params.selectedLabel or params.selectedRow['obs_year'] or params.selectedRow[0] do contain the year of the colum that is selected.

If used in the $drilldown.next i get the following error in the console

[Deprecation] Synchronous XMLHttpRequest on the main thread is deprecated because of its detrimental effects to the end user's experience. For more help, check https://xhr.spec.whatwg.org/.
send @ jquery.min.js:4
ajax @ jquery.min.js:4
r._evalUrl @ jquery.min.js:4
Ja @ jquery.min.js:3
append @ jquery.min.js:3
(anonymous) @ jquery.min.js:3
T @ jquery.min.js:3
html @ jquery.min.js:3
(anonymous) @ CustomDrillDown.js:52
i @ jquery.min.js:2
fireWith @ jquery.min.js:2
A @ jquery.min.js:4
(anonymous) @ jquery.min.js:4
load (async)
send @ jquery.min.js:4
ajax @ jquery.min.js:4
next @ CustomDrillDown.js:42
(anonymous) @ (index):42
fireEvent @ chartjs.js:113
(anonymous) @ chartjs.js:55
handleEvent @ Chart.bundle.min.js:10
eventHandler @ Chart.bundle.min.js:10
n @ Chart.bundle.min.js:10
r.(anonymous function) @ Chart.bundle.min.js:10

Thx for the help Jure

KoolReport commented on Jul 17, 2018

Hi Jure,

This is a known issue. It is not error but a notice. Mean that everything still works so you may not need to worry, This notice is shown because a resource file of widget (like js) is loaded on the fly according to new suggestion of XMLHttpRequest usage. We will find the new way to load resource to remove that warning later on.

Jure Zakrajsek commented on Jul 17, 2018

Hi, Thx for this clarification on the error.

I still have to figure out how to narrow the select to only one dataset, as all three datasets return the params back to the $drilldown.next function which makes the page behave strange as described above?

Best regards

Jure Zakrajsek commented on Jul 22, 2018

Any help on this issue?

KoolReport commented on Jul 22, 2018

Let say if we have 3 levels of drilldown: Country( list sale of all countries) -> City (list all sale of cities in selected country) -> Province (list all sale of province in selected city)

In the first level, we will just to sale by country. On the selection of a country, we get the name of country in params.selectedRow[0] and send to next level like this: $drilldown.next({country:params.selectedRow[0]})

In the second level, now we have the $this->params["country"], we perform SQL query to get all sale by cities of that country. On the selection of city, we will have the name of city in params.selectedRow[0] and also the name of country in $this->params['country'] so we will send both to the third level

"itemSelect"=>"function(params){
    $drilldown.next({
        country:'".$this->params["country"]."',
        city:params.selectedRow[0]
    });
}
"

In the third level, we have both country and city available in the params: $this->params["country"] and $this->params["city"], we will use that to query all provinces and their sales.

Hope that my explanation is clear.

Please let me know if you need further help.

Jure Zakrajsek commented on Jul 22, 2018

Hi

Yes this is clear how to get the 3 level drilldown to work.

The issue i have is that if i plot multiple datasets on the ChartJS each click on a column returns 3 selectedValue objects (as in my second post) which seems to confuse the drilldown.next function in a way that if i put params.selectedRow[0] into it, it will jump more levels and renders the next report below the first chart (as on the image in the first post).

Thx for the help Jure

KoolReport commented on Jul 22, 2018

Although you have multiple dataset but all of them should have the same label on the x-axis, don't they. It could be params.selectedLabel. As I guide you in another topic, you may use console.log(params) to choose the parameters that work.

KoolReport commented on Jul 22, 2018

By the way, you mean you have 3 events at the same time, don't you? I miss that information. Wait for me for awhile.

KoolReport commented on Jul 22, 2018

On the itemSelect event, you check if the params.selectedColumnIndex==1 then you call $drilldown.next().

Jure Zakrajsek commented on Jul 22, 2018

Yes exactly. One click would return 3 selectedValue objects.

KoolReport commented on Jul 22, 2018

On the itemSelect event, you check if the params.selectedColumnIndex==1 then you call $drilldown.next(). This will assure that you call next() function only 1 time.

Jure Zakrajsek commented on Jul 24, 2018

Works like a charm :) Thx

Build Your Excellent Data Report

Let KoolReport help you to make great reports. It's free & open-source released under MIT license.

Download KoolReport View demo
help needed
solved

DrillDown