KoolReport's Forum

Official Support Area, Q&As, Discussions, Suggestions and Bug reports.
Forum's Guidelines

PDF export: chartjs AreaChart size issue #3376

Open Victoria Rodriguez opened this topic on 7 days ago - 3 comments

Victoria Rodriguez commented 7 days ago

For browser view the size works well, I can modify it to my liking. But when you want to render it in export for PDF, the size is very small and despite wanting to change the size, the graph does not change and remains small. Is this a PDF export problem?
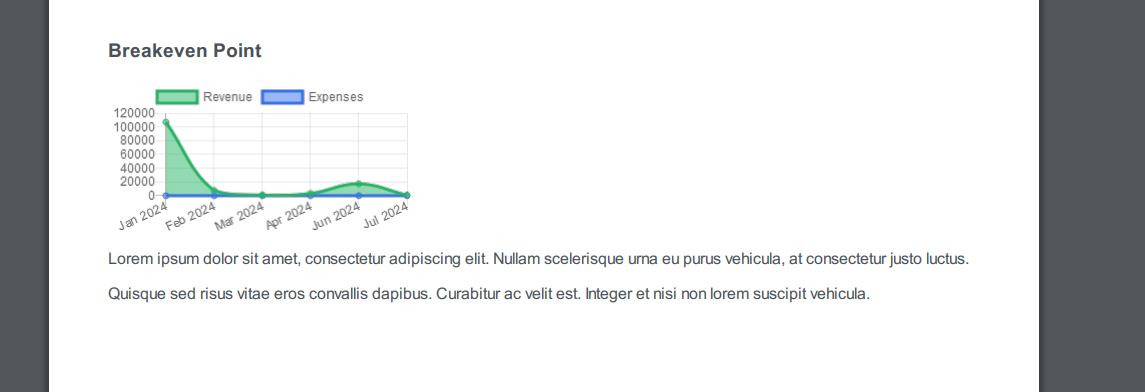
<?php
use \koolreport\chartjs\AreaChart;

                $breakeven_data_raw = $this->dataStore('breakeven_chart_data')->toArray();
                $breakeven_data = [];

                $timeRange = $this->params['dateRange'];

                $Last3Months = CustomDateRange::lastThreeMonths();
                $Last6Months = CustomDateRange::lastSixMonths();
                $Thisyear = CustomDateRange::thisYear();
                $Lastyear = CustomDateRange::lastYear();

                if ($timeRange == $Last3Months || $timeRange == $Last6Months || $timeRange == $Thisyear || $timeRange == $Lastyear) {
                    foreach ($breakeven_data_raw as $entry) {
                        $month = date('M Y', strtotime($entry['formated_sold_date']));
                        if (!isset($breakeven_data[$month])) {
                            $breakeven_data[$month] = [
                                'date_time' => $month,
                                'sold_amount' => 0,
                                'monthly_press_payment' => 0,
                            ];
                        }
                        $breakeven_data[$month]['sold_amount'] += $entry['sale_price'];
                        $breakeven_data[$month]['total_cost'] = $entry['variable_cost'];
                    }

                    $breakeven_data = array_values($breakeven_data);
                } else {
                    foreach ($breakeven_data_raw as &$entry) {
                        $formattedDate = date('j M y', strtotime($entry['formated_sold_date']));
                        $entry['date_time'] = $formattedDate;
                    }
                    $breakeven_data = $breakeven_data_raw;
                }


                AreaChart::create(array(
                    "dataSource" => $breakeven_data,
                    "columns" => array(
                        "date_time",
                        "sold_amount" => array(
                            "label" => "Revenue",
                            "type" => "number",
                            "prefix" => "$"
                        ),
                        "monthly_press_payment" => array(
                            "label" => "Expenses",
                            "type" => "number",
                            "prefix" => "$"
                        ),
                    ),
                    "colorScheme" => array(
                        "#26b564", 
                        "#3471eb"  
                    ),
                    "options" => array(
                        "responsive" => true, 
                        "scales" => array(
                            "x" => array(
                                "type" => "time",
                                "time" => array(
                                    "unit" => "month", 
                                ),
                                "title" => array(
                                    "display" => true,
                                    "text" => "Date"
                                ),
                                "ticks" => array(
                                    "autoSkip" => true,  
                                    "maxTicksLimit" => 12,  
                                    "maxRotation" => 0,  
                                    "minRotation" => 0, 
                                ),
                            ),
                            "y" => array(
                                "title" => array(
                                    "display" => true,
                                    "text" => "Amount"
                                ),
                                "ticks" => array(
                                    "beginAtZero" => true, 
                                    "stepSize" => 5000, 
                                    "maxTicksLimit" => 10,  
                                ),
                            ),
                        ),
                        "plugins" => array(
                            "legend" => array(
                                "display" => true,
                            ),
                        ),
                        "width" => 800, 
                        "height" => 800
                    ),
                ));
                ?>


Sebastian Morales commented 6 days ago

Pls move your "width" and "height" properties to the outside of "options" like this and try exporting again:

                AreaChart::create(array(
                    ...
                    "options" => array(
                        ...
                    ),
                    "width" => 800, 
                    "height" => 800
                )); 
Victoria Rodriguez commented 6 days ago

I have also tried putting it outside of options but it doesn't work either, it remains reduced in size. It only happens within the pdf view.

Victoria Rodriguez commented 6 days ago

I was able to solve it by wrapping the graph in a container and specifying width with style tag. thank you so much!!

Build Your Excellent Data Report

Let KoolReport help you to make great reports. It's free & open-source released under MIT license.

Download KoolReport View demo
help needed
solved

Export