KoolReport's Forum

Official Support Area, Q&As, Discussions, Suggestions and Bug reports.
Forum's Guidelines

ApexCharts multilne category label #3352

Closed Filip opened this topic on on Oct 14 - 6 comments

Filip commented on Oct 14

Hi, I need to force word wrap or multilne category label. It is possible according to Apex documentation:

https://apexcharts.com/docs/multiline-text-and-line-breaks-in-axes-labels/

Setting options I could only change label field width, but it is not possible to wrap words or force multine label.

 "options"=>array(
                        "yaxis"=>array(
                           "labels"=>array(
                              "show" => true,
                              "maxWidth" => 200
                           ))
                        ),

Could anyone support me in solving this issue ?

Bright commented on Oct 14

Hi, you have to use xaxis not yaxis

Filip commented on Oct 14

Hi Bright, I was thinking so, but it seems if I want to manipulate with category labels I need to use yaxis options set. Below my sample code with 2 cases:

  1. xaxis opions set = no reaction on category
 "xaxis"=>array(
                           "labels"=>array(
                              "show" => true,
                              "maxWidth" => 300
                           ))
                        ),

  1. yaxis options set
 "yaxis"=>array(
                           "labels"=>array(
                              "show" => true,
                              "maxWidth" => 300
                           ))
                        ),

Anyway it is still not solving my issue - how to force multinle label. Looking in source rednered code there is <text> tag used, so no chance to use css for that...

Bright commented on Oct 14

Just convert the normal string to an array of strings in your data. For example:

['ZAM', '02/2024', 'Jan Kowalski'] 

instead of

'ZAM 02/2024 Jan Kowalski'

or you can use

"xaxis"=> array(
  categories=> array(
    ['ZAM', '02/2024', 'Jan Kowalski'],
   ...
  )
)

That's what I meant just now. Sorry for not being clear.

Filip commented on Oct 14

Thanks Bright, in my case data source is from MySql query and I have tried already to combine category name using this rule directly in query, but it doeasn't work if defined in "columns". I can combine such a string directly in query using:

->query( "SELECT CONCAT('[\'',OrderNumber,'\',\'',Worker,'\']') AS WorkerComb,(...)

(...)
  ->pipe(new ColumnRename(array(
            "WorkerComb"=>"Pracownik",
(...)

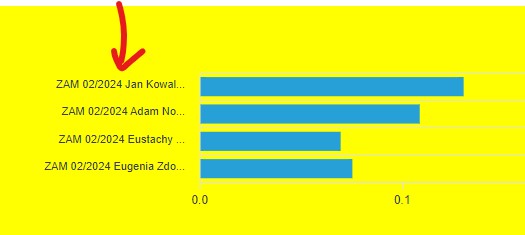
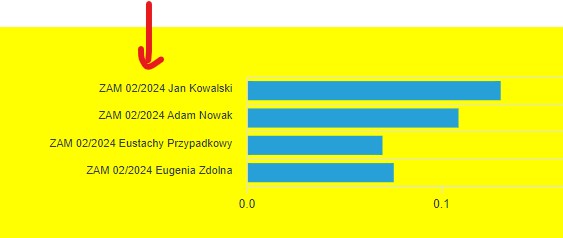
...but how to refer to this in xaxis | categories ?

At the moment I have following:

 protected function setup() {
        //Select the data source
        $this->src("3Mreport")
        ->query("
        SELECT CONCAT_WS('\n',OrderNumber,Worker) AS WorkerComb, Station, WGCode, WGName,unit,EffectiveTime, TotalTime, QtyDone, Efektywność, Wydajność, GoalMAX, GoalMIN, EGoal
        FROM WE_STA_TempFinal
        ")
        ->pipe(new ColumnRename(array(
            "WorkerComb"=>"Pracownik",
            "Station"=>"Stanowisko",
            "WGCode"=>"Kod wyrobu",
            "WGName"=>"Nazwa wyrobu",
            "unit"=>"Jedn.",
            "EffectiveTime"=>"Czas efektywny",
            "TotalTime"=>"Czas całkowity",
            "QtyDone"=>"Ilość",
            "GoalMAX"=>"Norma MAX",
            "GoalMIN"=>"Norma MIN",
            "EGoal"=>"Norma akt."
        )))
        ->pipe($this->dataStore("results"));
    }
}

in BarChart create I have:

\koolreport\apexcharts\BarChart::create(array(
                        "name"=>"testchart",
                        "dataSource"=>$this->dataStore('results'),
                        "columns" => array(
                           'Pracownik',
                           'Wydajność' => array(
                              'type'=>'number',
                              'decimals'=>2,
                           ),
                           'Norma MAX' => array(
                              'type'=>'number',
                              'decimals'=>2,
                              'marker' => [
                                 'strokeWidth' => 5,
                                 'strokeColor' => '#775DD0'
                              ]
                           ),
                           'Norma MIN' =>[
                              'marker' => [
                                 'strokeWidth' => 5,
                                 'strokeColor' => '#775DD0'
                              ]

                              ],
                           'Norma akt.'=>[
                              'marker' => [
                                 'strokeWidth' => 5,
                                 'strokeColor' => '#775DD0'
                              ]

                           ]
                              ),
                     "options"=>array(
                        "chart" => array(
                           "height" => '200px',
                        ),
                        
                        "xaxis"=>array(
                           "labels"=>array(
                              "show" => true,
                              "maxWidth" => 300
                           ))
                        ),
 
                      "maxWidth" => "80%",
                     ));
Bright commented on Oct 14

Is the data returned from $this->dataStore('results') an array?

If not try "dataSource"=>$this->dataStore('results')->toArray() You need to make sure the data you put into dataSouce is an array and the category name is an array of strings. If you want to reference axis | categories you have to enter it manually, which is not recommended for large data

Filip commented on Oct 14

Thanks Bright - that's it !

Just for the others - here is the sollution - best way is to copy query result to an array, then create an array of category names:

 $data=$this->dataStore('results')->toArray();
            $i=0;
            $cat[]="";
            foreach($data as $res) {
               $cat[$i]=array($res['Pracownik'],$res['Numer zamówienia'],$res['Kod wyrobu']);
               $i=$i+1;
            }

Build Your Excellent Data Report

Let KoolReport help you to make great reports. It's free & open-source released under MIT license.

Download KoolReport View demo
help needed
solved

ApexCharts