KoolReport's Forum

Official Support Area, Q&As, Discussions, Suggestions and Bug reports.
Forum's Guidelines

Set X Axis Default on 0 #3336

Closed shafiqah opened this topic on on Sep 12 - 2 comments

shafiqah commented on Sep 12

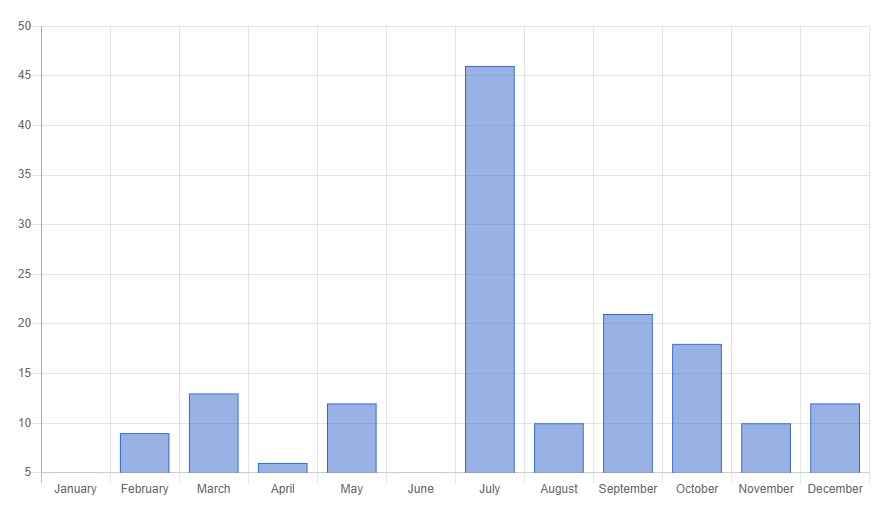
Hi, just need some help on how to configure the X Axis to start with the value 0 in the chart. The problem that I'm facing right now is the value of X-Axis always refer to the minimum value of the data. Referring to the chart below, the minimum value is 5 so the minimum value at X-Axis also 5.

This is a piece of my code

            Level::create()
                ->title(function($params){ return $params["year"]; })
                ->widget
                (
                    KWidget::create()
                    ->use(\koolreport\chartjs\ColumnChart::class)
                    ->dataSource
                    (
                        function($params, $scope) use ($curStud)
                        {
                            return ePNJ::rawSQL(
                            "
                                SELECT 
                                    MONTHNAME(register_date) AS months,
                                    COUNT(id) AS total_stud
                                FROM student
                                WHERE YEAR(register_date) = '".$params["year"]."'
                                GROUP BY MONTH(register_date)
                                ORDER BY MONTH(register_date)
                            ")->run();
                        }
                    )
                    ->columns
                    ([
                        "months"=>["type"=>"string"],
                        "total_stud"=>[
                            "type"=>"number",
                        ]    
                    ])
                    ->settings([
                        "tooltip"=>[
                            "use"=>"value",
                        ],
                        "options" => [
                            "legend" => ["position" => "right"],
                        ],
                    ])    

Hope you can help me out. Thanks!

Bright commented on Sep 13

Hi shafiqah,

You do this:

        "options" => array(
            ...
            "scales" => array(
                "yAxes" => array(
                    array(
                        "ticks" => array(
                            "min" => 0
                        )
                    )
                )
            )
        )
shafiqah commented on Sep 15

It worked! Thanks!

Build Your Excellent Data Report

Let KoolReport help you to make great reports. It's free & open-source released under MIT license.

Download KoolReport View demo
solved

ChartJS