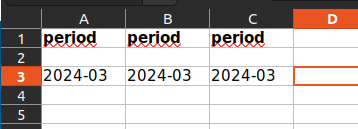
Export to excel
class PluginReportingSetting extends \koolreport\KoolReport
{
	use \koolreport\export\Exportable;
	use \koolreport\excel\ExcelExportable;

	public function generateExcel($is_browser = true)
	{
		if ($is_browser) {
			$this->exportToExcel("templateExcel")->toBrowser("report.xls");
		} else {
			$this->exportToExcel("templateExcel")->saveAs(GLPI_TMP_DIR . "/report.xls");
		}
	}
}
Excel view
<?php
global $DB;

$options = $this->params;
$iterator = [];
$report = new PluginReportingReporting();
if ($report->getFromDB($options['id'])) {
	$iterator = $DB->request([
		'FROM'   => PluginReportingChart::getTable(),
		'WHERE'  => ['plugin_reporting_reportings_id' => $report->getID()],
		'ORDER' => 'ranking ASC'
	]);
}
?>
<div sheet-name="<?php echo __('Filter') ?>">
	<div><?php echo $report->fields['name'] ?></div>
	<div><?php echo $report->fields['comment'] ?></div>
	<?php
	$filters = [];
	foreach ($iterator as $data) {
		$setting = new $data['chart_class']();
		$filters = array_merge($filters, $setting::getFilters($data['chart_name']));
	}

	foreach ($filters as $filter) {
		$value = '';
		if (isset($options[$filter])) {
			$value = $options[$filter];
		}
		echo "<div>";
		echo $setting::getFilterName($filter, $value);
		echo "</div>";
	}
	?>
</div>
<?php
foreach ($iterator as $data) {
	$setting = new $data['chart_class']();
	$function = $setting::getChartFunction($data['chart_name']);
	if ($function) {
		$setting->run();
		$info = $setting->{$function}($options);
		$name = $setting::getChartName($data['chart_name']);
		if (strlen($name) > 31) {
			$name = substr($name, 0, 31);
		}
		echo "<div sheet-name='" . $name . "'>";
		if ($data['chart_type'] == $setting::CARD) {
			echo "<div>" . $info['data'] . "</div>";
		} else {
			echo "<div>";
			$info['data'] = $setting::cleanHtml($info['data']);
			\koolreport\excel\Table::create([
				'dataSource' => new koolreport\core\DataStore($info['data']),
			]);
			echo "</div>";
		}
		echo "</div>";
	}
}
?>
