KoolReport's Forum
Official Support Area, Q&As, Discussions, Suggestions and Bug reports.
Forum's Guidelines
Apexcharts Multiview #3252
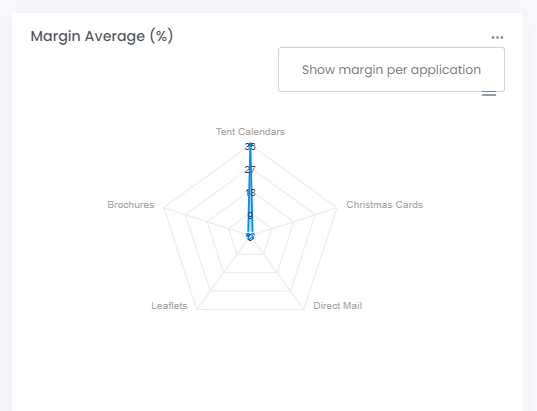
Of course. Here's the code:
<div class="col-md-4 mb-4">
    <div class="card" style="height: 100%;">
        <div class="card-header">
            <div class="card-actions float-end">
                <div class="dropdown position-relative">
                    <a href="#" data-bs-toggle="dropdown" data-bs-display="static">
                        <i class="align-middle" data-feather="more-horizontal"></i>
                    </a>
                    <div class="dropdown-menu dropdown-menu-end">
                        <a id="displayAveragePerCity" class="dropdown-item" href="#" hidden>Show margin per city</a>
                        <a id="displayAveragePerApplication" class="dropdown-item" href="#">Show margin per application</a>
                    </div>
                </div>
            </div>
            <h5 class="card-title mb-0">Margin Average (%)</h5>
        </div>
        <!-- Per Application -->
        <div id="averagePerApplicationChart" class="card-body" hidden>
            <?php
            $average_app_margin = $this->dataStore('average_margin_application')->toArray();

            if (!count($average_app_margin)) {
                echo '<div class="d-flex justify-content-center">
                                            <span class="text-info text-sm-center">No data available</span>
                                          </div>';
            } else {

                foreach ($average_app_margin as &$row) {

                    $margin = floatval($row['total_margin'] ?? 0);
                    $row['total_margin'] = number_format($margin, 2, '.', '');
                }

                \koolreport\apexcharts\RadarChart::create(array(
                    "dataSource" => $average_app_margin,
                    "columns" => array(
                        "job_application" => [
                            "label" => "Application"
                        ],
                        "total_margin" => [
                            "label" => "Total Margin",
                            "type" => 'number',
                            "suffix" => "%",
                        ],
                    ),
                    "showLegend" => false,
                    "widthHeightAutoRatio" => 1.5
                ));
            }
            ?>

        </div>
        <!-- Per City -->
        <div id="averagePerCityChart" class="card-body">
            <?php
            $average_city_margin = $this->dataStore('average_margin_city')->toArray();


            foreach ($average_city_margin as &$row) {

                $margin = floatval($row['total_margin'] ?? 0);
                $row['total_margin'] = number_format($margin, 2, '.', '');
            }

            echo json_encode($average_city_margin);

            \koolreport\apexcharts\RadarChart::create(array(
                "dataSource" => $average_city_margin,
                "columns" => array(
                    "client_city" => [
                        "label" => "City"
                    ],
                    "total_margin" => [
                        "label" => "Total Margin",
                        "type" => 'number',
                        "suffix" => "%"
                    ],
                ),
                "showLegend" => false,
            ));
            ?>

        </div>
    </div>
</div>

<script>
        // Toggles between Margin per City and Application Charts
        $("document").ready(function() {
            $("#displayAveragePerCity").click(function(){
                $('div#averagePerCityChart').removeAttr('hidden');
                $("div#averagePerApplicationChart").attr('hidden', true);
                $("a#displayAveragePerCity").attr('hidden', true);
                $('a#displayAveragePerApplication').removeAttr('hidden');
            });

            $("#displayAveragePerApplication").click(function(){
                $('div#averagePerApplicationChart').removeAttr('hidden');
                $('div#averagePerCityChart').attr('hidden', true);
                $("a#displayAveragePerApplication").attr('hidden', true);
                $('a#displayAveragePerCity').removeAttr('hidden');
            });
        });

    </script>
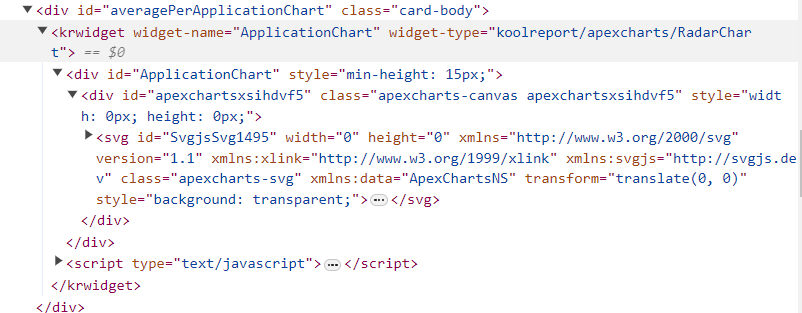
It could be the case that when the parent div of an ApexCharts chart is hidden, the chart itself could not be renderer correctly. Pls try the following solution:
- When you remove hidden attribute of a chart's parent div, redraw the chart with the following javascript command:
<?php
        \koolreport\apexcharts\LineChart::create(array(
            "name" => "chart1", // a chart's PHP name is its client site object name as well
            ...
?>
<script>
    function redrawChart1() {
        var apexchartsObj = chart1.chart(); //chart1 is KoolReport chart object
        apexchartsObj.resetSeries();
        // or:
        // window.dispatchEvent(new Event('resize')); // window resize forces apexcharts' redraw
    }
</script>
Let us know how this works for you.
Build Your Excellent Data Report
Let KoolReport help you to make great reports. It's free & open-source released under MIT license.
Download KoolReport View demo
