KoolReport's Forum

Official Support Area, Q&As, Discussions, Suggestions and Bug reports.
Forum's Guidelines

Sizing a D3 line chart #2925

Open Richb201 opened this topic on on Dec 30, 2022 - 1 comments

Richb201 commented on Dec 30, 2022

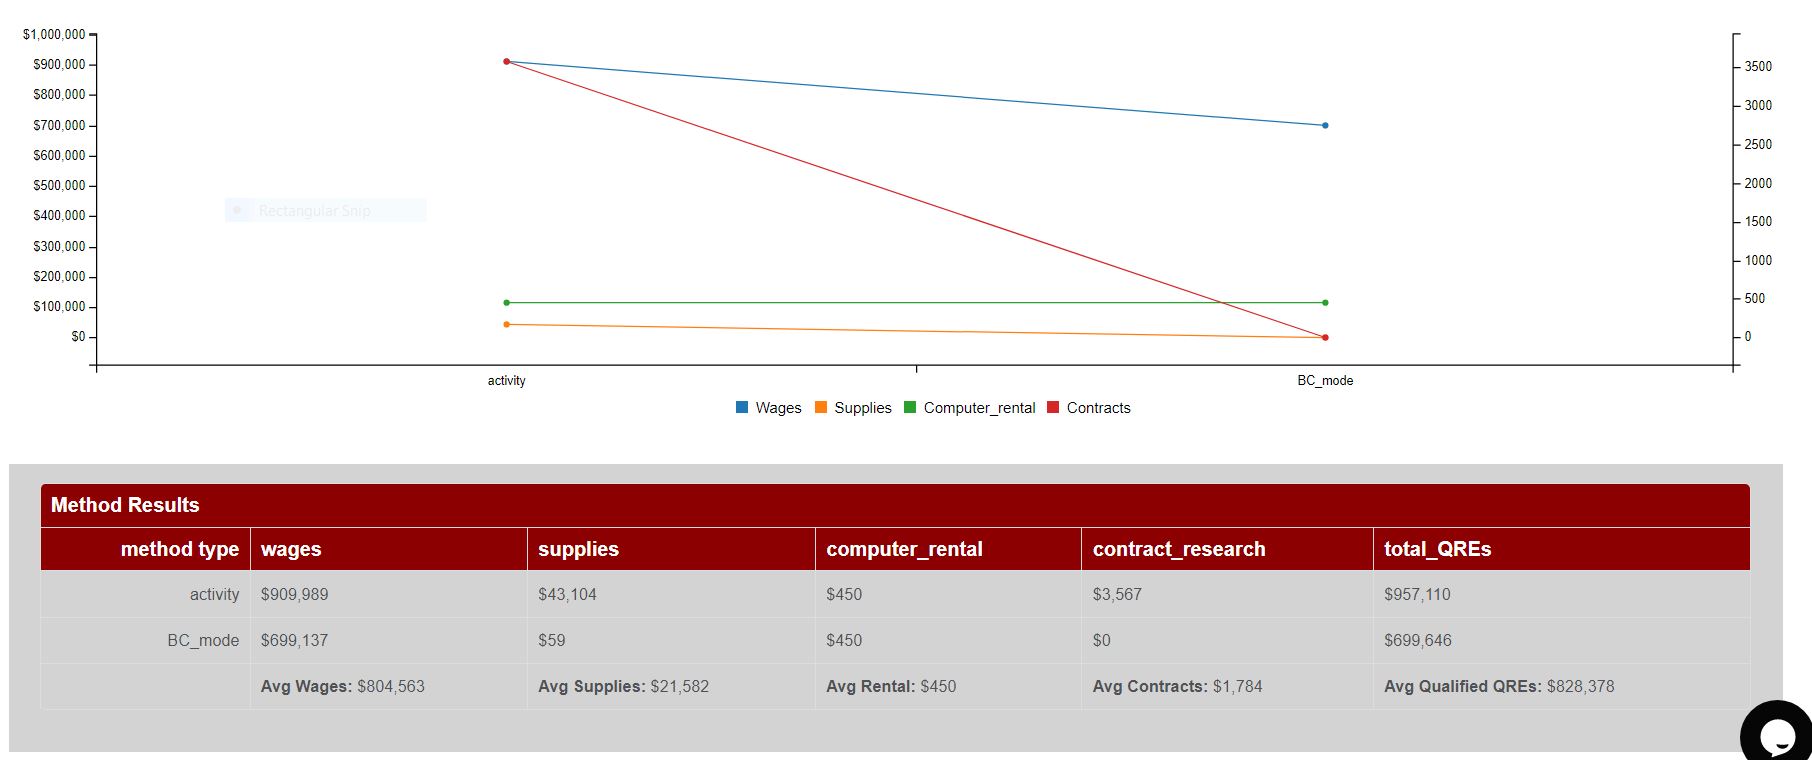
My code below creates a line chart but I only have two categories on the x axis. How can I reduce the horiz size so it doesn't look so silly?

<?php

LineChart::create(array(
    "dataStore"=>$this->dataStore("results"),

    "columns"=>array(
        "type",
        "wages"=>array(
            "label"=>"Wages",
            "type"=>"number",
            "prefix"=>"$"
        ),
        "supplies"=>array(
            "label"=>"Supplies",
            "type"=>"number",
            "prefix"=>"$"
        ),
        "computer_rental"=>array(
            "label"=>"Computer_rental",
            "type"=>"number",
            "prefix"=>"$",
            "axis"=>"y2"
        ),
        "contract_research"=>array(
            "label"=>"Contracts",
            "type"=>"number",
            "prefix"=>"$",
            "axis"=>"y2"
        ),
    ),
    "yAxis"=>array(
        "prefix"=>"$"
    ),
    "dualAxis"=>true
));
?>

Sebastian Morales commented on Jan 3, 2023

Pls try setting a "width" for your chart and see if it affects the chart display.

Build Your Excellent Data Report

Let KoolReport help you to make great reports. It's free & open-source released under MIT license.

Download KoolReport View demo
help needed

None