KoolReport's Forum
Official Support Area, Q&As, Discussions, Suggestions and Bug reports.
Forum's Guidelines
Static bar #284
What you can do is to add extra row to dataStore which look like this
$extra_row = array(
    "person"=>"All",
    "sale"=>10000
);

$data = $this->dataStore("storeName")->data(); // <-- get data from store
array_push($data,$extra_row); // <-- Adding a total row
$this->dataStore("storeName")->data($data); //<--Push back data to store
After this code, your dataStore("storeName") will have another row contain total sale, when you draw chart, it will appear as a column.
To sum all the sale, you do this:
$sum_all_sales = $this->dataStore("storeName")->sum("agent_sale"); // <- agent_sale is column name.
To add the column bar, just do the same like my previous code. By adding more rows to $data and at the end, save back to dataStore, you will get the new column bar in ColumnChart
What I mean is you have to do like this:
$static_row = array(
    "person"=>"Static",
    "sale"=>10000
);

$sum_row = array(
    "person"=>"Sum All",
    "sale"=>$this->dataStore("storeName")->sum("sale")
);

$data = $this->dataStore("storeName")->data(); // <-- get data from store
array_push($data,$static_row); // <-- Adding a static row
array_push($data,$sum_row); // <-- Adding a sum row
$this->dataStore("storeName")->data($data); //<--Push back data to store
Yes It is. here is the full code ::
 function setup()
    {


      $this->src('sales')
->pipe(new Map(array(
      '{value}' => function($row, $metaData) {
        if ( trim($row['Date']) != 'TOTAL')
          return array($row);
      },
    )))

->pipe(new Group(array(
            "by"=>"Date",
        )))
->pipe(new Sort(array(
            "Date"=>function($m1, $m2) {
                $map = array(
                    'JANVIER' => 1,
                    'FÉVRIER' => 2,
                    'MARS' => 3,
                    'AVRIL' => 4,
                    'MAI' => 5,
                    'JUIN' => 6,
                    'JUILLET' => 7,
                    'AOÛT' => 8,
                    'SEPTEMBRE' => 9,
                    'OCTOBRE' => 10,
                    'NOVEMBRE' => 11,
                    'DECEMBRE' => 12
                );
                return $map[$m1] > $map[$m2];
            }
        )))

        ->pipe($this->dataStore('date'));

$filter_args = array("or");
foreach($this->params["thedate"] as $date)
{
    array_push($filter_args,array(
        "Date","=",$date
    ));
}

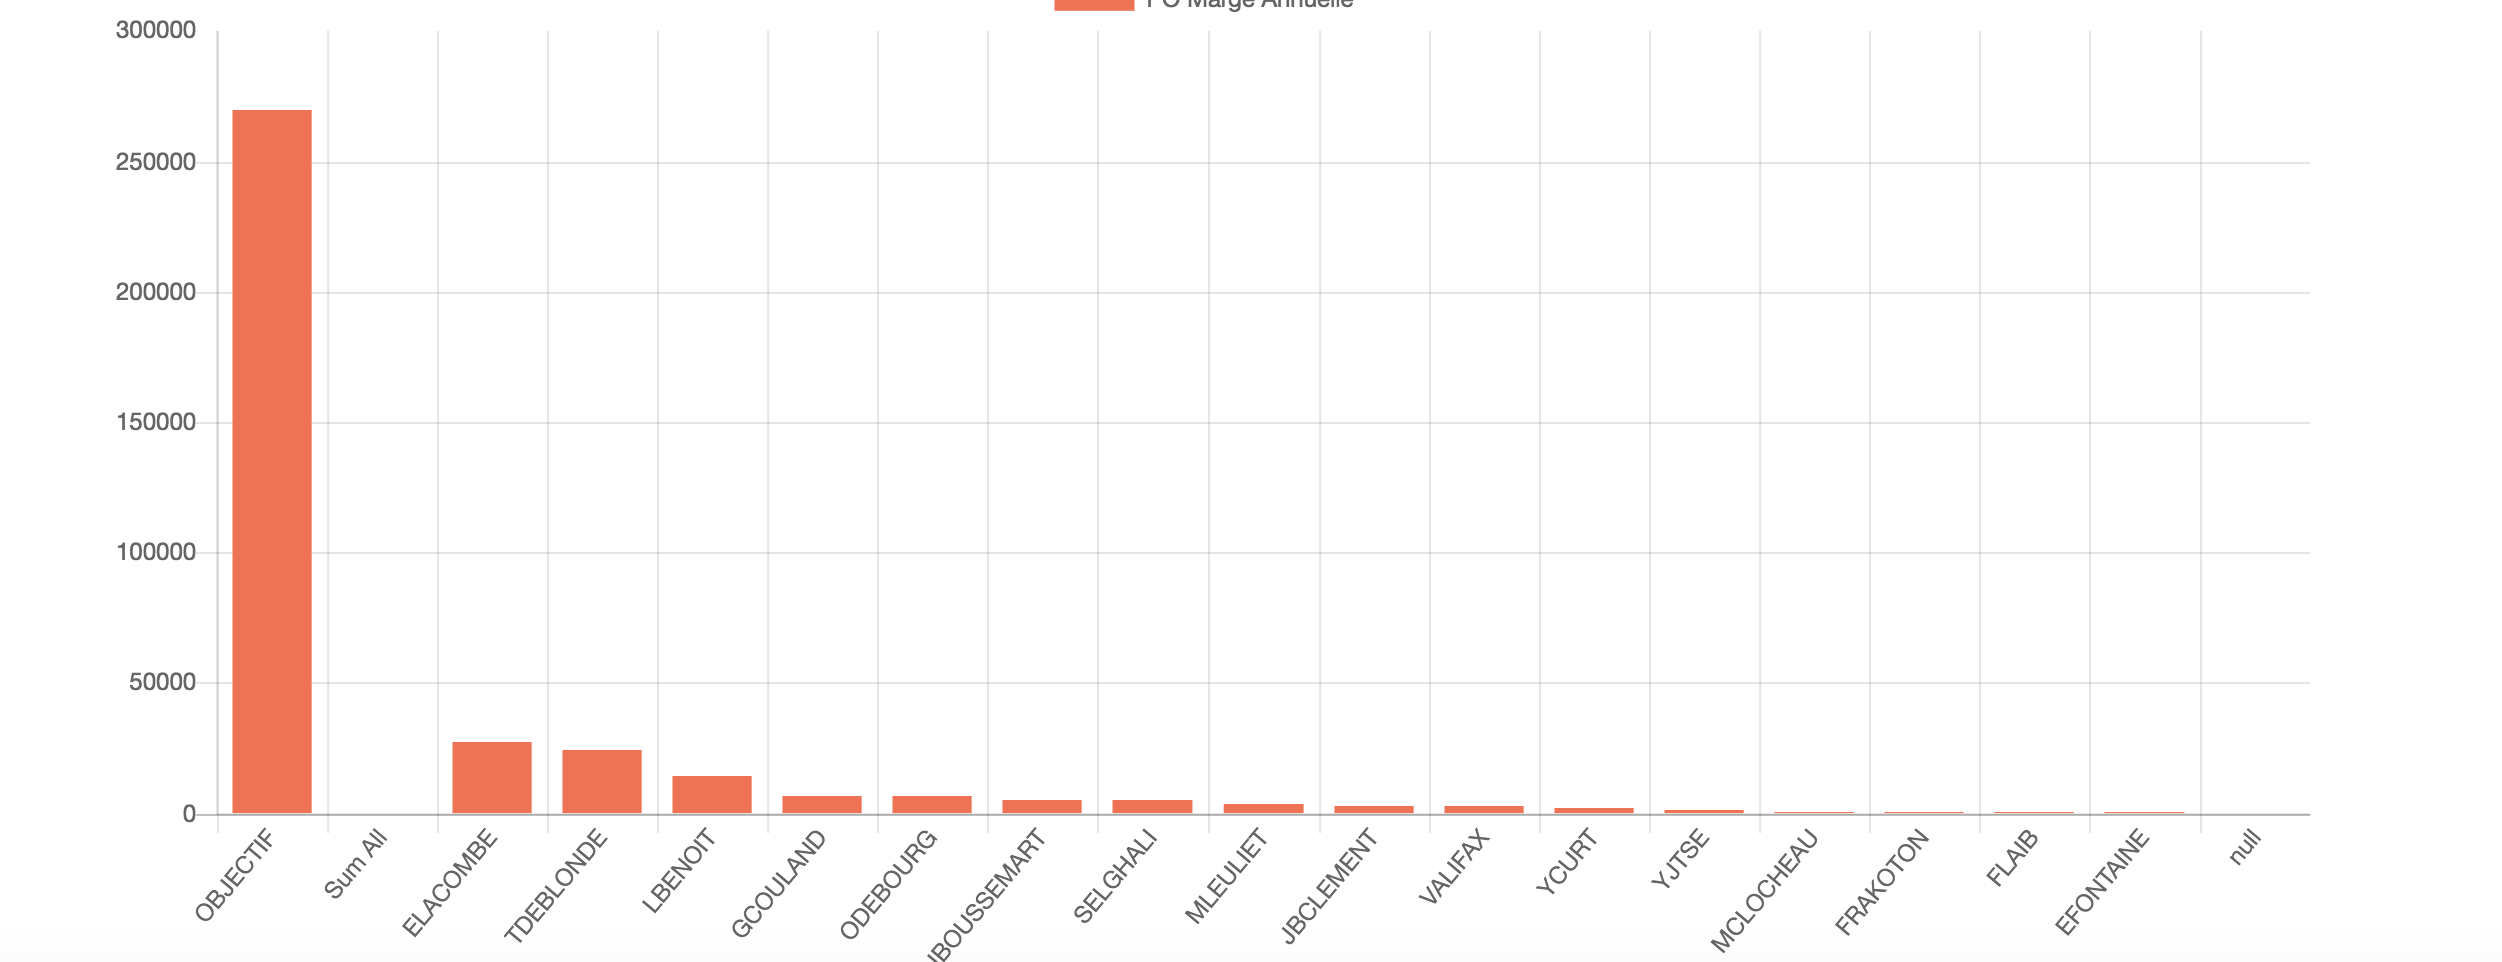
$extra_row = array(
    "Ccial"=>"OBJECTIF",
    "PO"=>270000
);

$sum_row = array(
    "Ccial"=>"Napsis",
    "PO"=>$this->dataStore("PO_marge")->sum("PO")
);


$data = $this->dataStore("PO_marge")->data(); // <-- get data from store
array_push($data,$extra_row); // <-- Adding a total row
array_push($data,$sum_row);
$this->dataStore("PO_marge")->data($data); //<--Push back data to store


//PO

 $this->src('sales')
 ->pipe(new Filter(array(
            array("Date","=",'AVRIL'),
            'or',
           array("Date","=",'MAI'),
            'or',
           array("Date","=",'JUIN'),
        )))

     ->pipe(new CalculatedColumn(array(
            "PO"=>function($data){
                        return  ( $data["Marge_FAS_Déclarée"] + 12 * $data["MARGE_DELTA_REC"] );
            }
        )))


 ->pipe(new Group(array(
            "by"=>"Ccial",
            "sum"=>"PO",
        )))

->pipe(new Sort(array(
            "PO"=>"desc"
        )))


->pipe($this->dataStore("PO_marge"));
Oh I see the problem now. The code that I told you to add should be in the view, not in the setup. It should be like this.
<?php
$static_row = array(
    "person"=>"Static",
    "sale"=>10000
);

$sum_row = array(
    "person"=>"Sum All",
    "sale"=>$this->dataStore("storeName")->sum("sale")
);

$data = $this->dataStore("storeName")->data(); // <-- get data from store
array_push($data,$static_row); // <-- Adding a static row
array_push($data,$sum_row); // <-- Adding a sum row
$this->dataStore("storeName")->data($data); //<--Push back data to store

ColumnChart::create(array(
    "dataSource"=>$this->dataStore("storeName")
));
?>
To use the sum(), we need all data available. In the setup phase, there is no data in the store, that's why you will get 0 of sum.
Build Your Excellent Data Report
Let KoolReport help you to make great reports. It's free & open-source released under MIT license.
Download KoolReport View demo
