KoolReport's Forum
Official Support Area, Q&As, Discussions, Suggestions and Bug reports.
Forum's Guidelines
Select2 with google charts #2727
Pls check this example, just replace MultiSelect with Select2:
https://www.koolreport.com/examples/reports/inputs/order_list/
I've checked that example but I think that's not what I'm looking for. I have a table with data from a sql database, and I can filter that table. What I want to do now is to create some Donut Charts ans Column Charts with the data I'm presenting in the table. So, if I filter the table I want to filter those Charts according to the filter I've used in the table
If you can filter your table with Select2 you can filter your charts with Select2, too. Just apply the same filter by Select2 to your charts' data pipes and datastores. If it's not working for you or there's an error, pls post your php code and screenshots. Tks,
ok, so I have this table that works perfectly fine with the filters:
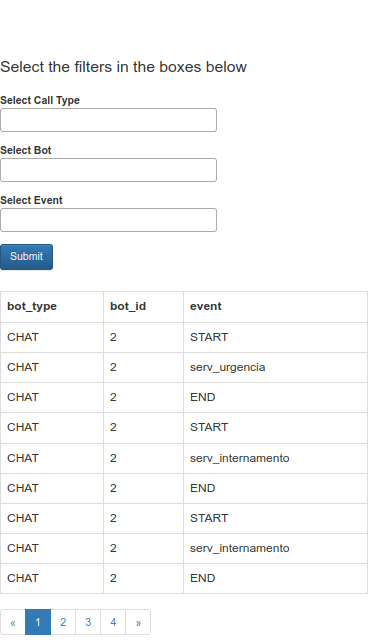
and I just added this Column Chart:
I don't know why it's showing up like that, with so many empty spaces that shouldn't be there
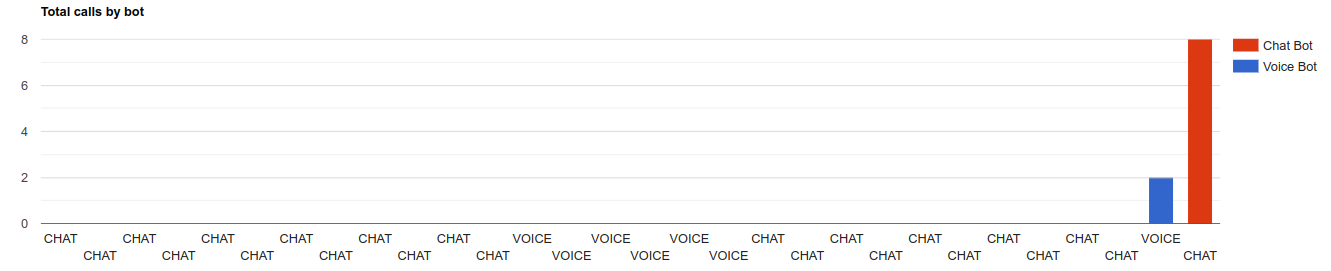
now let's imagine that in filters I select "serv_internamento", the table will only show me the lines that have that event, but the chart will show like this:
PS: In the table theres some parameters showing "0", that's not supposed to be there as well. They weren't there before I added the Column Chart to my code.
This is my Report.php:
<?php


require_once "/opt/reports/autoload.php";
require_once "/opt/reports/koolreport/amazing/tests/cases/load.koolreport.php";

use \koolreport\dashboard\widgets\Text;
use \koolreport\dashboard\widgets\google\ColumnChart;
use \koolreport\dashboard\widgets\Table;

class Report extends koolreport\KoolReport
{

	use \koolreport\clients\Bootstrap;
	use \koolreport\inputs\Bindable;
    use \koolreport\inputs\POSTBinding;

	protected function defaultParamValues()
    {
        return array(
            "bot_type"=>array(),
            "bot_tame"=>array(),
            "event"=>array(),
        );
    }

	protected function bindParamsToInputs()
    {
        return array(
            "bot_type",
            "bot_name",
            "event"
        );
    }

	protected function settings()
    {
		return array(
			"dataSources"=>array(
                "bots"=>array(
                    "connectionString"=>"pgsql:host=1**.0.0.*;port=5**3;dbname=bots;",
                    "dataFormat"=>"table",
                    'username' =>"pos***es",
                    'password' =>"***********",
									),
								)
	);
	}

	protected function setup()
    {

		// add the variable to query_params to be used as parameter for sql query
		$query_params = array();
        if($this->params["bot_type"]!=array())
        {
            $query_params[":bot_type"] = $this->params["bot_type"];
        }
        if($this->params["bot_id"]!=array())
        {
            $query_params[":bot_id"] = $this->params["bot_id"];
        }
        if($this->params["event"]!=array())
        {
            $query_params[":event"] = $this->params["event"];
        }


		$this->src("bots")->query("select
                bot_type,
                bot_name,
                event,
				bot_id
				from botfacts
				where 1=1
            ".(($this->params["bot_type"]!=array())?"and bot_type in (:bot_type)":"")."
            ".(($this->params["bot_id"]!=array())?"and bot_id in (:bot_id)":"")."
            ".(($this->params["event"]!=array())?"and event in (:event)":"")."
        ")->params($query_params)
        ->pipe($this->dataStore("botfacts"));

        $this->src("bots")->query("select
        bot_type,
                sum(case when bot_type='VOICE' and event='START' then 1 else 0 END) as voice_calls,
                sum(case when bot_type='CHAT' and event='START' then 1 else 0 END) as chat_calls
                from botfacts where bot_type notnull group by bot_type;")
        ->params($query_params)
        ->pipe($this->dataStore("botfacts"));


	}
}
This is my Report.view.php:
<?php

use \koolreport\widgets\koolphp\Table;
use \koolreport\widgets\google\ColumnChart;
use \koolreport\inputs\Select2;

?>
<html>
<body style="width:100%;">
<div class="report-content" style="width: auto;">

  <div class="report-content">
    <div class="text-center">
        <h1>Bot Statistics</h1>
        <div class="text-left">
        <p class="lead">
            Select the filters in the boxes below
        </p>
        </div>
    </div>

        <form method="post">
          <div class="row">
            <div class="col-md-6">
              <div class="form-group" style="width:30%;">
                  <b>Select Call Type</b>
                    <?php
                        Select2::create(array(
                            "multiple"=>true,
                            "name"=>"bot_type",
                            "dataSource"=>$this->src("bots")->query("
                                select bot_type
                                from botfacts
                                where bot_type <> ''
                                group by bot_type
                            "),
                            "attributes"=>array(
                                "class"=>"form-control"
                            )
                        ));
                    ?>
              </div>

              <div class="form-group" style="width:30%;">
                <b>Select Bot</b>
                  <?php
                    Select2::create(array(
                        "multiple"=>true,
                        "name"=>"bot_id",
                        "dataSource"=>$this->src("bots")->query("
                            select bot_id
                            from botfacts
                            where bot_id <> ''
                            group by bot_id
                        "),
                        "attributes"=>array(
                            "class"=>"form-control"
                        )
                    ));
                  ?>
              </div>

              <div class="form-group" style="width:30%;">
                <b>Select Event</b>
                  <?php
                    Select2::create(array(
                        "multiple"=>true,
                        "name"=>"event",
                        "dataSource"=>$this->src("bots")->query("
                            select event
                            from botfacts
                            where event <> ''
                            group by event
                        "),
                        "attributes"=>array(
                            "class"=>"form-control"
                        )
                    ));
                  ?>
              </div>

              <div class="form-group">
                  <button class="btn btn-primary">Submit</button>
              </div>
            </div>
          </div>

        </form>

        <div style="width:25%;">
          <?php
            Table::create(array(
                "dataSource"=>$this->dataStore("botfacts"),
                "columns"=>array(
                    "bot_type",
                    "bot_id",
                    "event"
                ),
                "paging"=>array(
                    "pageSize"=>9
                ),
                "cssClass"=>array(
                    "table"=>"table-bordered"
                )
            ));
          ?>
        </div>

        <div class="row" style="display: flex; flex-direction: row;">
        <div class="column-total" style="flex-grow:1;">
          <?php
            ColumnChart::create(array(
            "title"=>"Total calls by bot",
            "dataSource"=>$this->dataStore('botfacts'),
            "width"=>"100%",
            "columns"=>array(
                "bot_type",
                "voice_calls"=>array("label"=>"Voice Bot"),
                "chat_calls"=>array("label"=>"Chat Bot")
            ),
            "options"=>array(
            "isStacked"=>true
            )
            ));
           ?>
        </div>
        </div>

  </div>


</div>
</body>
</html>
Thanks for your availability!!
I notice that there're 2 lines of this pipe in your report setup:
->pipe($this->dataStore("botfacts"));
...
->pipe($this->dataStore("botfacts"));
Your datastore contains both filtered data and non-filtered data. Make sure that the datastore used for your chart or table only contains filtered data from filtered query.
This is the query I have
$this->src("bots")->query("select
        bot_type,
                sum(case when bot_type='VOICE' and event='START' then 1 else 0 END) as voice_calls,
                sum(case when bot_type='CHAT' and event='START' then 1 else 0 END) as chat_calls
                from botfacts where bot_type notnull group by bot_type;")
        ->params($query_params)
        ->pipe($this->dataStore("colChart"));
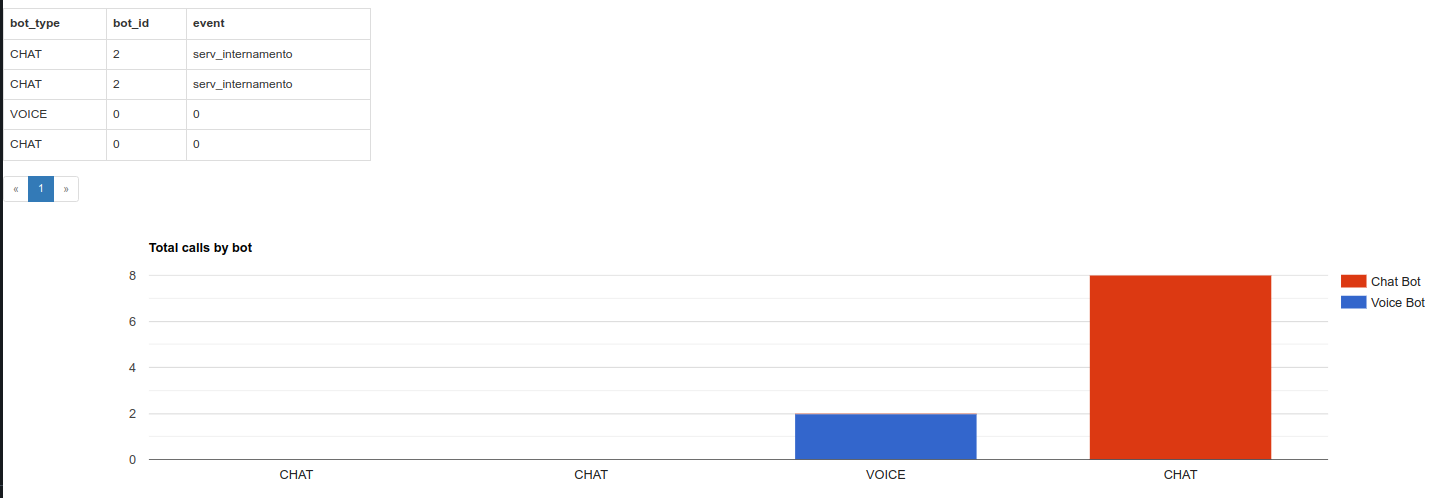
My column Chart shows like this:
Now let's say that in my filters above the table, in "events" I choose "serv_internamento". The column chart should show me 2 "CHAT" accordingly to what I have in my database but it keeps showing 2 "VOICE" and 8 "CHAT"
It's because your first column which is bot_type has 2 values bot_type='VOICE' and bot_type='CHAT' and you group by bot_type. The result would have 2 rows of 'VOICE' and 'CHAT'. You can not GROUP BY a column and expect multiple rows of same values, such as 2 'CHAT' rows. That's not what GROUP BY means.
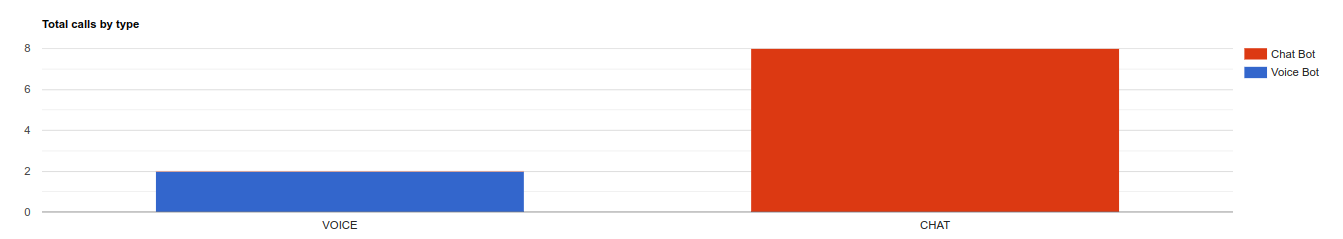
I'm sorry, that's not what I meant. If I don't have any filter the chart should show just like it is in the image. But, when in the filters I choose "serv_internamento" I want the chart to show me only one row, and it should be the CHAT row reaching the value 2 instead of the value 8 like it was before. Why? Because in my database I don't have any VOICE with "serv_internamento", and I only have 2 "CHAT" 's with "serv_internamento".
Build Your Excellent Data Report
Let KoolReport help you to make great reports. It's free & open-source released under MIT license.
Download KoolReport View demo