KoolReport's Forum

Official Support Area, Q&As, Discussions, Suggestions and Bug reports.
Forum's Guidelines

Dashboard and combo chart like line #2662

Open fiuncho opened this topic on on May 8, 2022 - 12 comments

fiuncho commented on May 8, 2022

Dear team.

Using KoolReport Dashboard Pro.

Using ComboChart

How can I set a value like line or bar into values?

This is my class, and I want to show like lines the values for: "pr_model1", "pr_model2" and "pr_model3"

class InstrumentLines extends ComboChart {

protected function onInit()
{
    $this->title("Instrument Evolution")
            ->colorScheme(ColorList::random())
    ;
}

protected function dataSource()
{
    $select_query = InstrumentDB::$instrument_query;

	...
    return InstrumentDB::rawSQL($select_query);
}

protected function fields()
{
    return [
        DateTime::create("timestamp_to_local")->displayFormat("d/m/Y H:i:s")
            ->sort("asc"),
        Currency::create("instrument_val")
            ->decimals(8)
        Currency::create("pr_model1")
            ->decimals(8),
        Currency::create("pr_model2")
            ->decimals(8),
        Currency::create("pr_model3")
        ->decimals(8)
    ];
}

}

Thanks for all.
KoolReport commented on May 9, 2022

Can you please explain further your need.

"How can I set a value like line or bar into values?" <- I have not yet understood your request.

If you could, please attach some images/ drawing, it will help me very much.

Regards,

fiuncho commented on May 9, 2022

Hi!!!

Simple, I want to show the column "instrument_val" like a "bar", and the other ones like a "line".

By default, I am showing all of them like a "bar".

I do not know how can I change the type.

Best!!!

KoolReport commented on May 9, 2022

Let try to set chartType for a field like below

protected function fields()
{
    return [
        DateTime::create("timestamp_to_local")->displayFormat("d/m/Y H:i:s")
            ->sort("asc"),
        Currency::create("instrument_val")
            ->decimals(8)
        Currency::create("pr_model1")
            ->decimals(8)
            ->chartType("line"), // Like this
        Currency::create("pr_model2")
            ->decimals(8),
        Currency::create("pr_model3")
        ->decimals(8)
    ];
}

Please let me know if it works.

fiuncho commented on May 9, 2022

Thanks for your reponse but: :(

Message: Call undefined chartType() method

This is my first aproach to koolreport. I'm very lost

Sorry

KoolReport commented on May 10, 2022

Let me tell dev.team to inspect and come back to you

fiuncho commented on May 10, 2022

Dear team!!!

Yes, please, go ahead!!!

KoolReport commented on May 13, 2022

One question: Are you using chartjs ComboChart?

fiuncho commented on May 13, 2022

Yes.

        use \koolreport\dashboard\widgets\chartjs\ComboChart
KoolReport commented on May 13, 2022

I see, our team tried to test on google ComboChart and it seems to work. For the chartjs you do this:


    return [
        DateTime::create("timestamp_to_local")->displayFormat("d/m/Y H:i:s")
            ->sort("asc"),
        Currency::create("instrument_val")
            ->decimals(8)
        Currency::create("pr_model1")
            ->decimals(8)
            ->config([
                "type"=>"line"
            ]), // Like this
        Currency::create("pr_model2")
            ->decimals(8),
        Currency::create("pr_model3")
        ->decimals(8)
    ];
}

Let me know if it works.

Latter we will make chartType settings for field like google chart, it will be much easier.

fiuncho commented on May 14, 2022

Did not Run!!! :(

fiuncho commented on May 14, 2022

Team!!

This is the solution. It is not cool, but runs.

If you want colunms and lines on ComboChart on your DashboardPro. You have to do something like this.

Please, take a look to the onInit() function,

protected function onInit() {

$this->title("Instrument Evolution")
        ->colorScheme(ColorList::random())
;

$this->columns(["timestamp_to_local",
				"volume"=>array(
					"label"=>"Instrument",
					"type"=>"number"
				),
				"model"=>array(
					"label"=>"Pr.Model1",
					"type"=>"number",
					"config"=>array(
						"type"=>"line",//Line chart is draw
						"borderWidth"=>3,
					)
				),
				"close_pr_model1"=>array(
					"label"=>"Pr.Model2",
					"type"=>"number",
					"config"=>array(
						"type"=>"line",//Line chart is draw
						"borderWidth"=>3,
					)
				),
				"close_pr_model2"=>array(
					"label"=>"Pr.Model3",
					"type"=>"number",
					"config"=>array(
						"type"=>"line",//Line chart is draw
						"borderWidth"=>3,
					)
				)
			]);


}

protected function dataSource() {

$select_query = InstrumentDB::$instrument_query;

...
return InstrumentDB::rawSQL($select_query);

}

protected function fields() {

return [
    DateTime::create("timestamp_to_local")->displayFormat("d/m/Y H:i:s")
        ->sort("asc"),
    Currency::create("instrument_val")
        ->decimals(8)
    Currency::create("pr_model1")
        ->decimals(8),
    Currency::create("pr_model2")
        ->decimals(8),
    Currency::create("pr_model3")
    ->decimals(8)
];

}

fiuncho commented on May 14, 2022

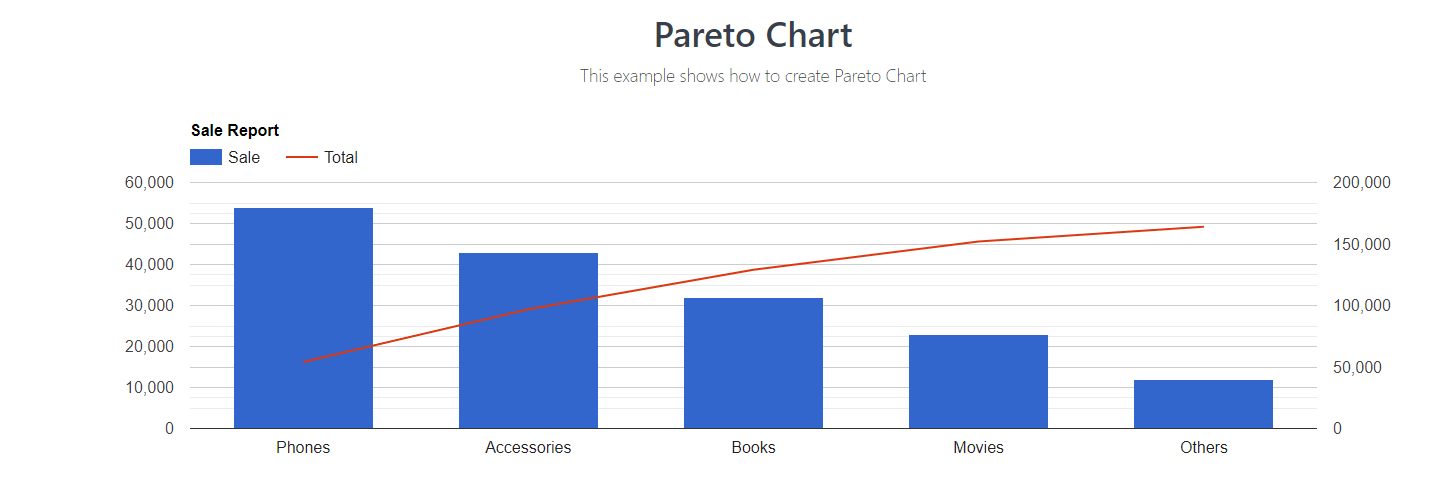
The first challenge was solved, now we have columns and lines on ComboChart. But, how can I change the axe for lines?

It means that I have two diferent scales of data.

The idea is something like this:

Build Your Excellent Data Report

Let KoolReport help you to make great reports. It's free & open-source released under MIT license.

Download KoolReport View demo
help needed

None