KoolReport's Forum
Official Support Area, Q&As, Discussions, Suggestions and Bug reports.
Forum's Guidelines
Chart when export to excel and view in web, i want to view annotation for other column #2406
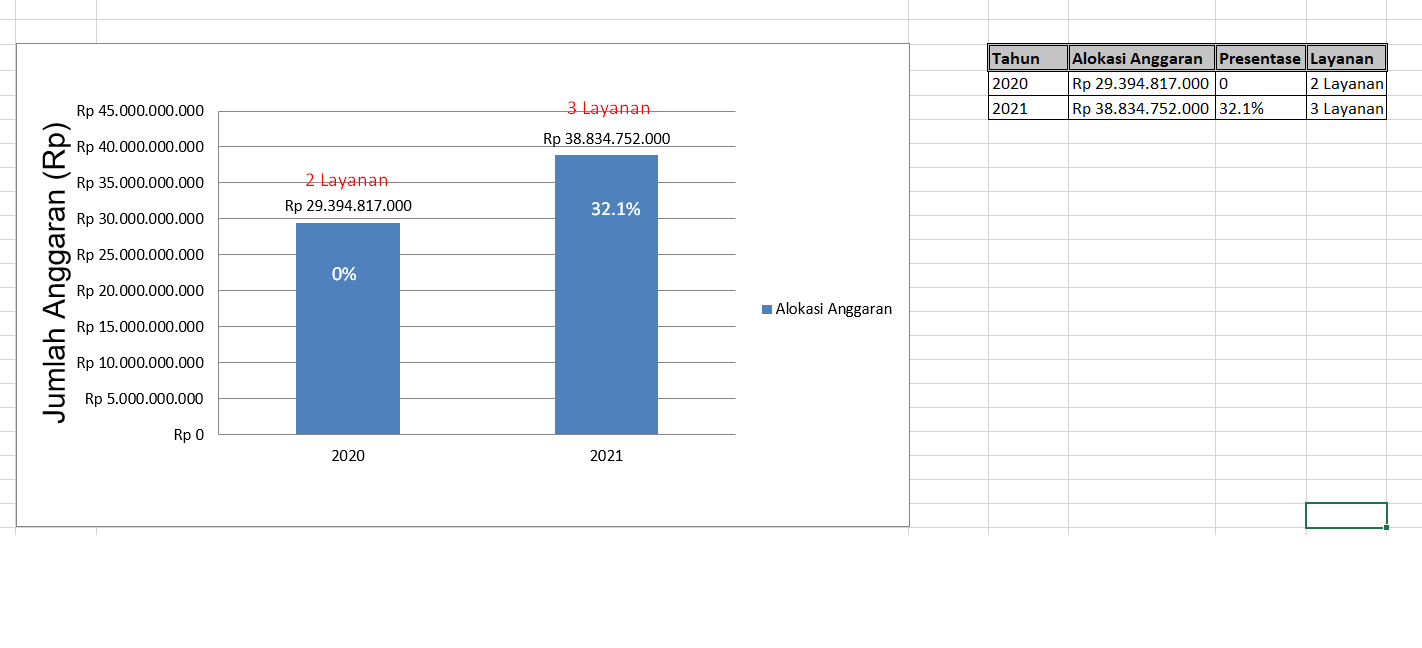
If you want to show percentage for each column, there's a layout's showPercent property like this:
\koolreport\excel\BarChart::create(array(
    ...
    "layout" => array(
        "showPercent" => true, // show percentage
        "showValue" => true, // show real value
        "showSerName" => true, // show series' name
        "showCatName" => true, // show category name
        "showLegendKey" => true,
    )
));
For any custom text I think column meta's prefix or suffix would be more relevant. Rgds,

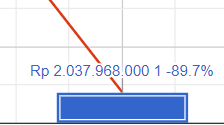
Except for the percentage I think you can use annotation text for Google Barchart. Pls try it and let us know if there's any issue with annotation. As for showing both the real values and their percentage per total sum we will look if there's possible solution for you. Rgds,
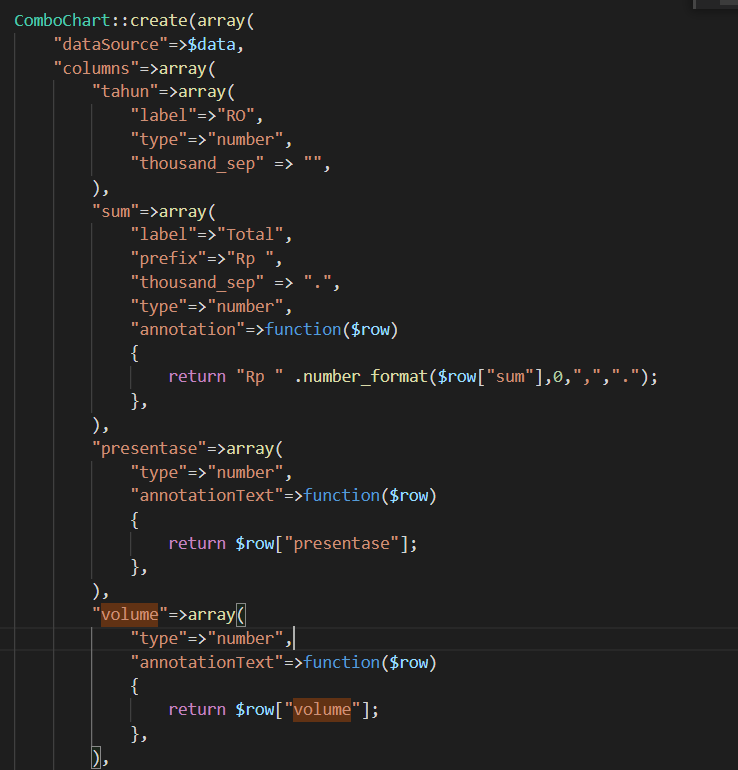
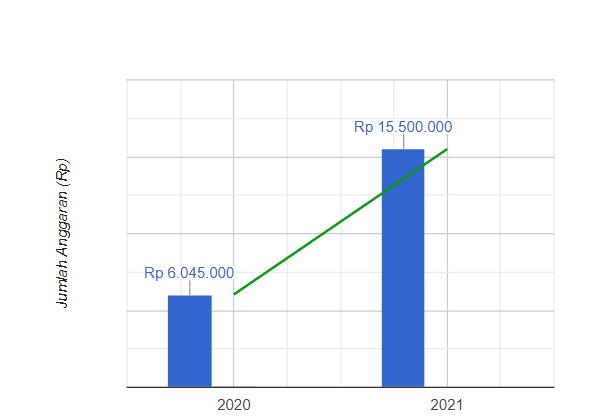
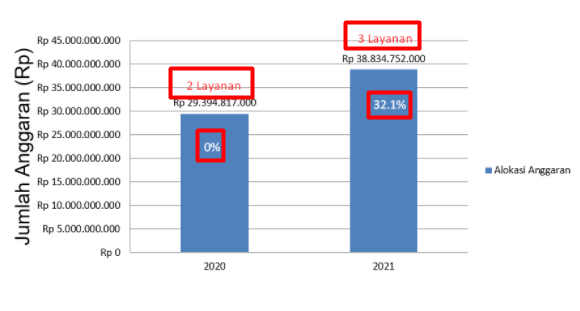
At the moment annotation of Google charts doesn't not support line break (or html). We could work around it by adding multiple annotations per series so that each annotation is on one line. To do that you would have to update the following file koolreport/core/src/widgets/google/Chart.php with this new code:
<?php
/**
 * This file is wrapper class for Google Chart
 *
 * @category  Core
 * @package   KoolReport
 * @author    KoolPHP Inc <support@koolphp.net>
 * @copyright 2017-2028 KoolPHP Inc
 * @license   MIT License https://www.koolreport.com/license#mit-license
 * @link      https://www.koolphp.net
 */

namespace koolreport\widgets\google;

use \koolreport\core\DataStore;
use \koolreport\core\Utility as Util;
use \koolreport\core\Widget;

/**
 * This file is wrapper class for Google Chart
 *
 * @category  Core
 * @package   KoolReport
 * @author    KoolPHP Inc <support@koolphp.net>
 * @copyright 2017-2028 KoolPHP Inc
 * @license   MIT License https://www.koolreport.com/license#mit-license
 * @link      https://www.koolphp.net
 */
class Chart extends Widget
{
    protected $chartId;
    protected $columns;
    protected $options;
    protected $type;
    protected $width;
    protected $height;
    protected $title;
    protected $colorScheme;
    protected $data;
    protected $clientEvents;
    protected $pointerOnHover;

    protected $mapsApiKey;
    protected $package = "corechart";
    protected $stability = "current";
    protected $language = "en";

    /**
     * Return the resource settings for table
     *
     * @return array The resource settings of table widget
     */
    protected function resourceSettings()
    {
        return array(
            "library" => array("jQuery"),
            "folder" => "clients",
            "js" => array("googlechart.js"),
        );
    }

    /**
     * Return the resource settings for table
     *
     * @return array The resource settings of table widget
     */
    protected function onInit()
    {
        $this->useDataSource();
        $this->useAutoName("gchart");

        $this->clientEvents = Util::get($this->params, "clientEvents", array());
        $this->columns = Util::get($this->params, "columns", null);
        $this->options = Util::get($this->params, "options", array());
        $this->width = Util::get($this->params, "width", "100%");
        $this->height = Util::get($this->params, "height", "400px");
        $this->title = Util::get($this->params, "title");
        $this->pointerOnHover = Util::get($this->params, "pointerOnHover");
        $this->mapsApiKey = Util::get($this->params, "mapsApiKey", '');
        $this->language = Util::get($this->params, "language", $this->language);
        $this->stability = Util::get($this->params, "stability", $this->stability);

        if (!$this->dataStore) {
            //Backward compatible with setting through "data"
            $data = Util::get($this->params, "data");
            if (is_array($data)) {
                if (count($data) > 0) {
                    $this->dataStore = new DataStore;
                    $this->dataStore->data($data);
                    $row = $data[0];
                    $meta = array("columns" => array());
                    foreach ($row as $cKey => $cValue) {
                        $meta["columns"][$cKey] = array(
                            "type" => Util::guessType($cValue),
                        );
                    }
                    $this->dataStore->meta($meta);
                } else {
                    $this->dataStore = new DataStore;
                    $this->dataStore->data(array());
                    $this->dataStore->meta(array("columns" => array()));
                }
            }
            if ($this->dataStore == null) {
                throw new \Exception("dataSource is required");
                return;
            }
        }

        $this->type = Util::getClassName($this);
        if ($this->type == "Chart") {
            $this->type = Util::get($this->params, "type");
        }
        //Color Scheme
        $this->colorScheme = Util::get($this->params, "colorScheme");
        if (!is_array($this->colorScheme)) {
            $theme = $this->getReport()->getTheme();
            if ($theme) {
                $theme->applyColorScheme($this->colorScheme);
            }
        }
        if (!is_array($this->colorScheme)) {
            $this->colorScheme = null;
        }
    }

    /**
     * Converting the type
     *
     * @param string $type Type of data
     *
     * @return string New type
     */
    protected function typeConvert($type)
    {
        $map = array(
            "datetime" => "datetime",
            "unknown" => "string",
            "string" => "string",
            "number" => "number",
        );
        return isset($map[$type]) ? $map[$type] : "string";
    }

    /**
     * Improve the column settings
     *
     * @return array Collumn section
     */
    protected function getColumnSettings()
    {
        //If there is the user input columns then parse them to columns from user input
        //If the user does not input collumns then take the default by looking at data
        // Then mixed with default in meta
        $meta = $this->dataStore->meta();
        $columns = array();
        if ($this->columns != null) {
            foreach ($this->columns as $cKey => $cValue) {
                if (gettype($cValue) == "array") {
                    $cMeta = Util::get($meta, ["columns", $cKey], []);
                    $columns[$cKey] = array_merge($cMeta, $cValue);
                } else {
                    $columns[$cValue] = $meta["columns"][$cValue];
                }
            }
        } else {
            $keys = array_keys($this->dataStore[0]);
            foreach ($keys as $ckey) {
                $columns[$ckey] = $meta["columns"][$ckey];
            }
        }
        return $columns;
    }

    /**
     * Prepare data
     *
     * @return null
     */
    protected function prepareData()
    {
        //Now we have $columns contain all real columns settings

        $columns = $this->getColumnSettings();

        $data = array();
        $header = array();
        $columnExtraRoles = array(
            "annotation", "annotationText", "certainty", "emphasis", "interval", "scope", "style", "tooltip"
        );
        foreach ($columns as $cKey => $cSetting) {
            $role = Util::get($cSetting, 'role');
            if (in_array($role, $columnExtraRoles)) {
                array_push($header, $cSetting);
            } else {
                array_push($header, "" . Util::get($cSetting, "label", $cKey));
                foreach ($columnExtraRoles as $cRole) {
                    if (isset($cSetting[$cRole])) {
                        array_push(
                            $header,
                            array(
                                "role" => $cRole,
                            )
                        );
                    }
                }
            }
        }
        array_push($data, $header);

        foreach ($this->dataStore as $row) {
            $gRow = array();
            foreach ($columns as $cKey => $cSetting) {
                $value = Util::get($row, $cKey);
                $cType = Util::get($cSetting, "type", "unknown");
                if ($cType === "number") {
                    $value = $value !== null ? floatval($value) : $value;
                } else if ($cType === "string") {
                    $value = "$value";
                }
                $fValue = $this->formatValue($value, $cSetting, $row);

                $role = Util::get($cSetting, "role");
                $columnExtraRoles = array(
                    "annotation", "annotationText", "certainty", "emphasis", "interval", "scope", "style", "tooltip"
                );
                if (in_array($role, $columnExtraRoles)) {
                    array_push($gRow, $fValue);
                } else {
                    array_push(
                        $gRow,
                        ($fValue === $value)
                        ? $value
                        : array("v" => $value, "f" => $fValue)
                    );
                }

                foreach ($columnExtraRoles as $cRole) {
                    if (isset($cSetting[$cRole])) {
                        array_push(
                            $gRow,
                            (gettype($cSetting[$cRole]) == "object") ?
                            $cSetting[$cRole]($row) :
                            $cSetting[$cRole]
                        );
                    }
                }
            }
            array_push($data, $gRow);
        }
        return $data;
    }

    /**
     * Return the formatted value
     *
     * @param mixed $value  The value needed to be formatted
     * @param array $format The format
     * @param array $row    The row containing this value
     *
     * @return null
     */
    protected function formatValue($value, $format, $row = null)
    {
        $formatValue = Util::get($format, "formatValue", null);

        if (is_string($formatValue)) {
            eval('$fv="' . str_replace('@value', '$value', $formatValue) . '";');
            return $fv;
        } else if (is_callable($formatValue)) {
            return $formatValue($value, $row);
        } else {
            return Util::format($value, $format);
        }
    }

    /**
     * Handle on render
     *
     * @return null
     */
    protected function onRender()
    {
        if ($this->dataStore->countData() > 0) {
            //Update options
            $options = $this->options;
            if ($this->title) {
                $options["title"] = $this->title;
            }
            if ($this->colorScheme) {
                $options["colors"] = $this->colorScheme;
            }
            //Render
            $this->template(
                "Chart",
                array(
                    "chartType" => $this->type,
                    "options" => $options,
                    "data" => $this->prepareData(),
                    "cKeys" => array_keys($this->getColumnSettings()),
                    "loader"=>array(
                        "package"=>$this->package,
                        "stability"=>$this->stability,
                        "language"=>$this->language,
                        "mapsApiKey"=>$this->mapsApiKey
                    )
                )
            );
        } else {
            $this->template("NoData");
        }
    }
}
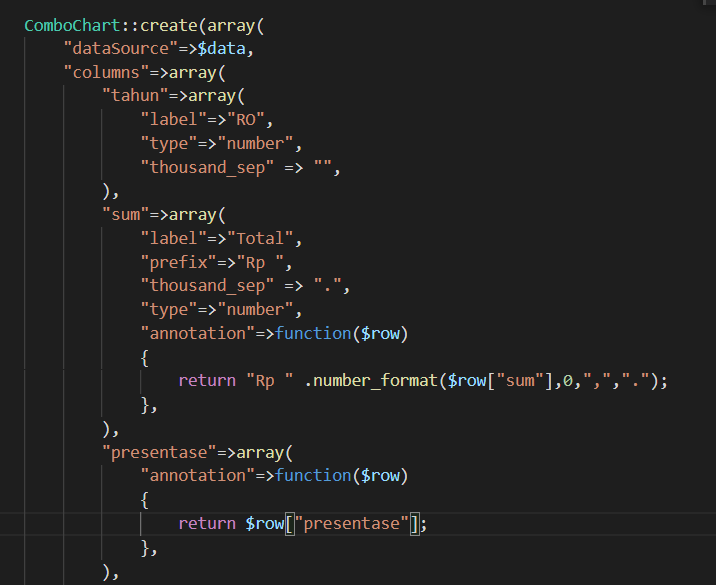
Then in your chart create, just add several annotation columns like this:
\koolreport\widgets\google\ColumnChart::create(array(
    ...
    "columns" => array(
        "LabelColumn" => array(...),
        "NumericColumn" => array(...),
        "AnnotationColumn1" => array(
            "role" => "annotation", // annotation column must have "role" => "annotation"
            "formatValue" => function($value, $row) {
                return $row["presentase"];
            },
        ),
        "AnnotationColumn2" => array(
            "role" => "annotation", // annotation column must have "role" => "annotation"
            "formatValue" => function($value, $row) {
                return $row["volume"];
            },
        ),
    ),
));
Build Your Excellent Data Report
Let KoolReport help you to make great reports. It's free & open-source released under MIT license.
Download KoolReport View demo