KoolReport's Forum

Official Support Area, Q&As, Discussions, Suggestions and Bug reports.
Forum's Guidelines

BarChart not working (trivial question ?) #239

Open Richi Ras opened this topic on on Apr 5, 2018 - 15 comments

Richi Ras commented on Apr 5, 2018

I'm sorry to ask for this question that could be trivial but I can't solve it and clear it:

I've a simple table that works like this


Table::create(array(
    "dataStore"=>$this->dataStore('amb_mod'),
    "columns"=>array(			
		"mydatefield"=>array(
			"label"=>"DATA",
			"type"=>"datetime",		
			),
        "mycustomerfield"=>array(
            "label"=>"CLIENTE",
            "type"=>"text",
        ),
        "myquantityfield"=>array(
            "label"=>"QUANTITA'",
            "type"=>"number",
                    )
    ),
    "cssClass"=>array(
        "table"=>"table table-hover table-bordered"
    )
));

I would like to make a BarChart and tried to make it simple by copying by example


BarChart::create
(
	array(
		"dataStore"=>$this->dataStore('amb_mod'), 
		"columns"=>array(
			"mycustomerfield"=>array(),	
			"myquantityfield"=>array()        		
		),		
		"width"=>"100%",
		"height"=>"500px"	
	)
);

But I get a js error in browser console: Uncaught SyntaxError: Unexpected token That's because the generated code is like this: `

googleChartLoader.load("current","corechart");

var gchart5ac602a18d9271 = new GoogleChart("BarChart","gchart5ac602a18d9271",,[]);        

Data param seems to be missing, why ?
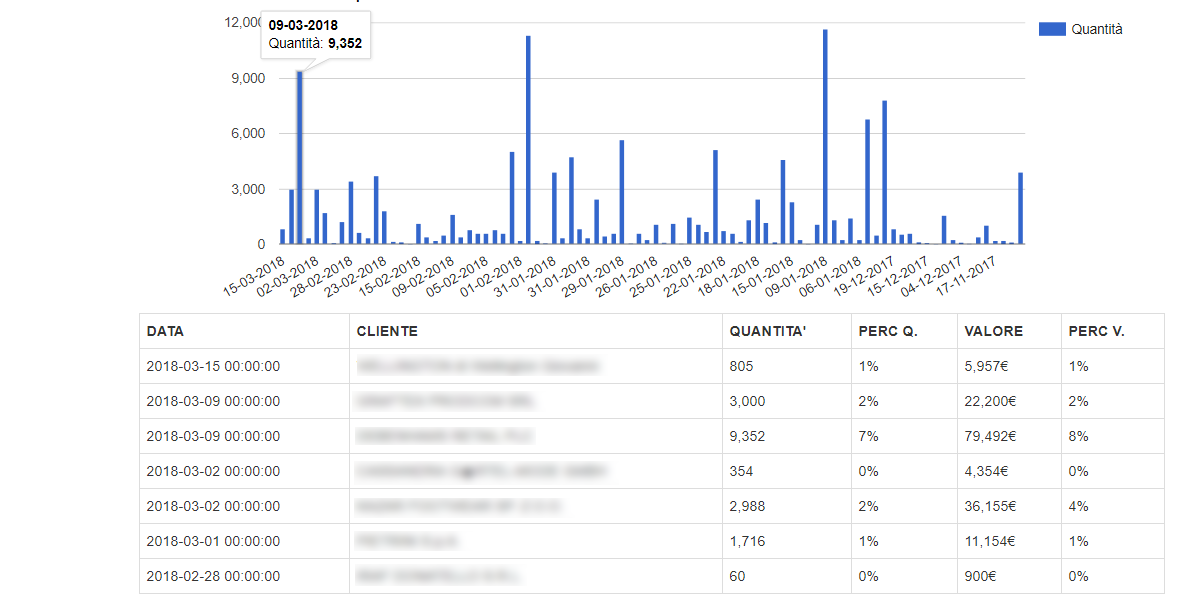
Richi Ras commented on Apr 5, 2018

There should be something related with aggregated data, because if in results there is only one (!) distinct mycustomerfield value the BarChart shows up !!

Richi Ras commented on Apr 9, 2018

I'm sorry again, could you please give any suggestion ?

Richi Ras commented on Apr 10, 2018

Well I purchase the ChartJS package as it will be useful in anyway, hoping to solve this issue with BarChart

KoolReport commented on Apr 11, 2018

I am sorry for my late reply. Did the ChartJS solve the issue?

BTW, what happen if you display data in table? Does it display normal. Please give me some screenshoot

Richi Ras commented on Apr 11, 2018

Hello, no it didn't solve, there should be something related with data aggregation on customer name field. I display data in table without specific problem related to that field (see attached screenshots) As you could see I create ColumnChart without problems, but here I don't set customer name field (ANDESCRI).

		->pipe(new Group(array("by"=>"ANDESCRI","sum"=>"MVQTAMOV")))		
 
 		->pipe(new CalculatedColumn(array(
			"valore"=>"({MVQTAMOV}*{MVPREZZO}*((100-{MVSCONT1})/100)*((100-{MVSCONT2})/100)*((100-{MVSCONT3})/100)*((100-{MVSCONT4})/100))" //
		)))	
        
		->pipe(new AggregatedColumn(array(
			"total"=>array("sum","MVQTAMOV")
		)))	
		->pipe(new CalculatedColumn(array(
			"PERC"=>"{MVQTAMOV}*100/{total}"
		)))				
		->pipe(new AggregatedColumn(array(
			"totalv"=>array("sum","valore")
		)))	
		->pipe(new CalculatedColumn(array(
			"PERCV"=>"{valore}*100/{totalv}"
		)))	
										
		->pipe(new Sort(array($sort=>$sortdir)))	

		->pipe($this->dataStore('amb_mod'));

  BarChart::create(array(
        "dataStore"=>$this->dataStore('amb_mod'), 
        "width"=>"100%",
        "height"=>"500px",
        "columns"=>array(
            "ANDESCRI",
      		"MVQTAMOV"
        ),
        "options"=>array(
            "title"=>"Sales By Customer",
        )
    ));
Richi Ras commented on Apr 11, 2018

Doing other testing it shows that is don't works only when I set as first field a specific field of my db (the customer name), I don't know what it could be... I'm on a SQL Server 2008 and the field is a char(60)

KoolReport commented on Apr 11, 2018

Do you mean if you display data amb_mod on table, you can include the column ANDESCRI without any problem. But when you used this column as the first column in the BarChart or ColumnChart then all failed?

If possible, please check the value of ANDESCRI column, is there any null data? is there any data has single quote or double quote (should be ok but I just want to make sure)

Richi Ras commented on Apr 11, 2018

Yes, it is as you described. I've now tested trying in some ways to remove any single quote: - by replacing in query - by excluding by query - by replacing with Pipe Custom field but nothing changed

KoolReport commented on Apr 11, 2018

Give me 1 day, I will make a testing case and come back with you with solution.

Richi Ras commented on Apr 11, 2018

Yes, thank you so much !!

Richi Ras commented on Apr 14, 2018

Hello, did you find any solution ? Is it possible that a Ü makes the issue ?

I confirm that filtering out the customer with that char the BarChart works fine !! It is really bad encoded because also on the table it cannot be readed...any solution to also "bad-view" that char also by the chart ?

KoolReport commented on Apr 16, 2018

I confirm that it is not the single quote and double quote causing issue since we have carefully escape those special character. Is your encoding is UTF8 or other?

KoolReport commented on Apr 16, 2018

Updated: We have tested the column with with "Ü" character, it is still working, we use the UTF8 so I guess it could be encoding causing issue. Please do this:

->pipe(new Custom(function($data){
    $data["ANDESCRI"] = utf8_encode($data["ANDESCRI"]);
    return $data;
})

Please put this after query() function so that data will be convert to utf8. Let me know if it works

Richi Ras commented on Apr 16, 2018

It works !! Thank you !!

KoolReport commented on Apr 16, 2018

Awesome

Build Your Excellent Data Report

Let KoolReport help you to make great reports. It's free & open-source released under MIT license.

Download KoolReport View demo
help needed

None