KoolReport's Forum

Official Support Area, Q&As, Discussions, Suggestions and Bug reports.
Forum's Guidelines

ChartJS Column Chart Layout - Need Help #2367

Open cfsinc opened this topic on on Oct 1, 2021 - 5 comments

cfsinc commented on Oct 1, 2021

Ok so im trying to produce the following

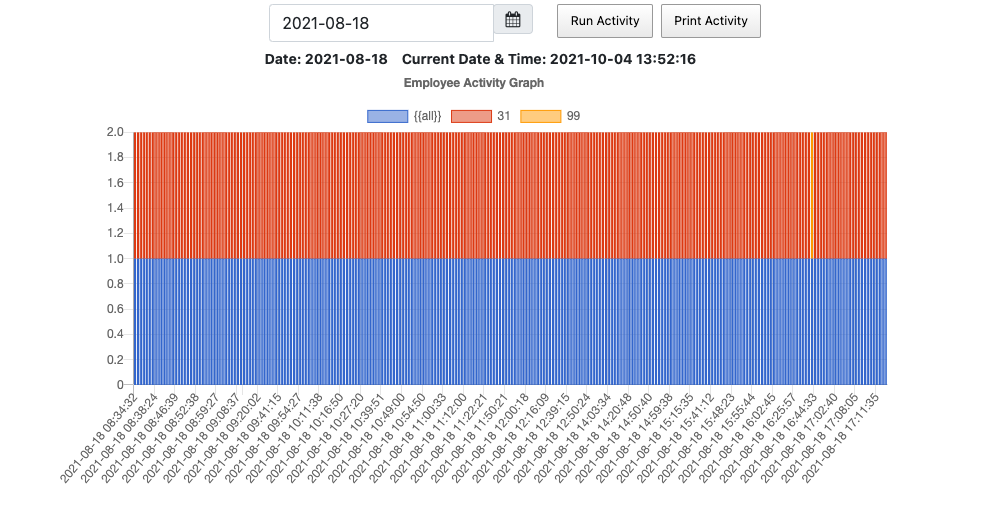
Column Chart that pulls a day of the following data Employees that had time stamps for doing particular tasks in our software So the day can have 1 or many employees with timestamps of tasks done in the day. I then want to put the count of an employees time stamps in a specific hour of the day. Got my datatables producing the table beautiful

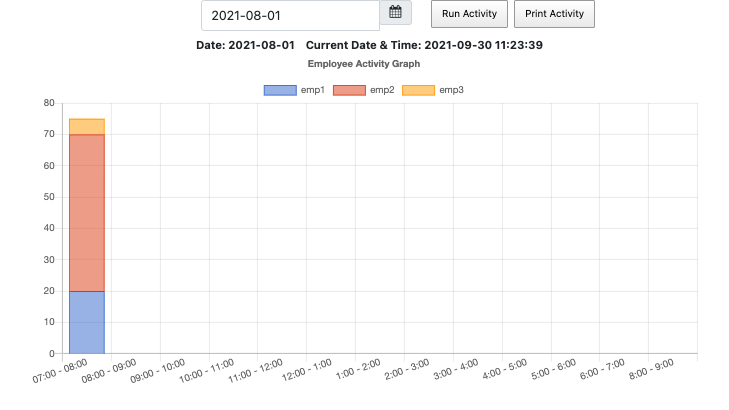
I just cant seem to get how to do it at the moment This is kind of how I need it to look. the count is how many time stamps each employee has for that hour. how do I lay this out as an array of employees and a count of their timestamps for the specific hour stacked by employee? How do I replace the example where I have the data static to show how I want it to look?

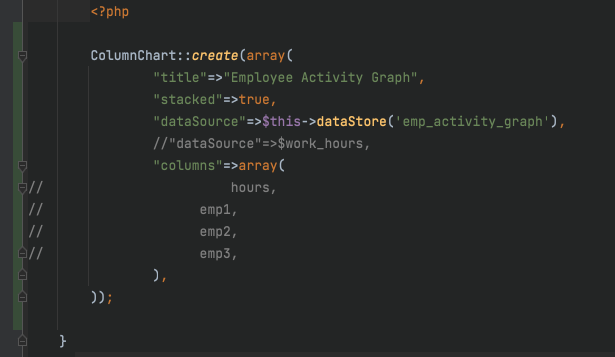
hours star at 7AM and go to 9pm and I got that to look right with this code but its static and I dont know how to put the counts from the employees in it as data from an array I create?

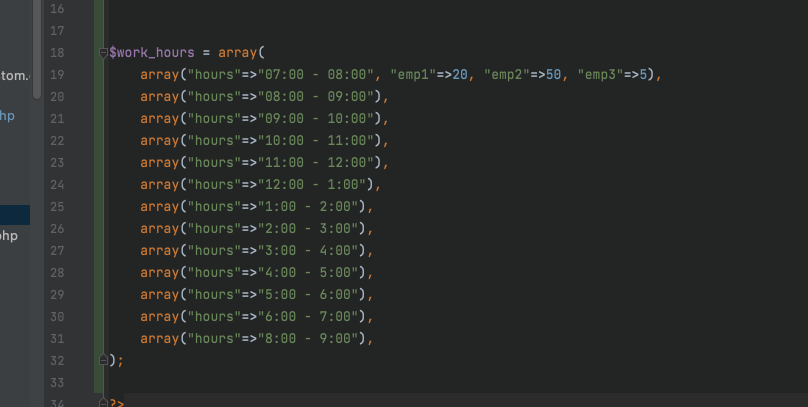
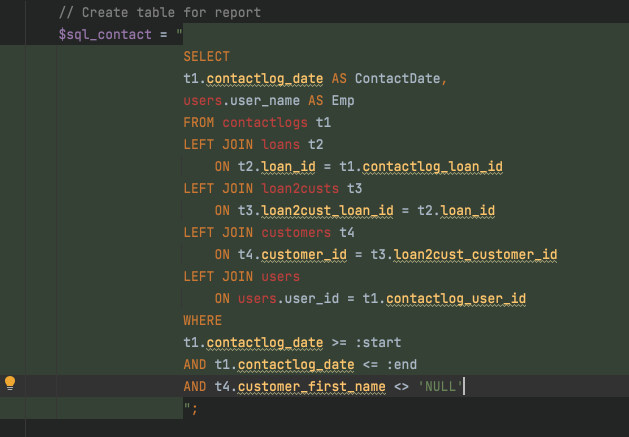
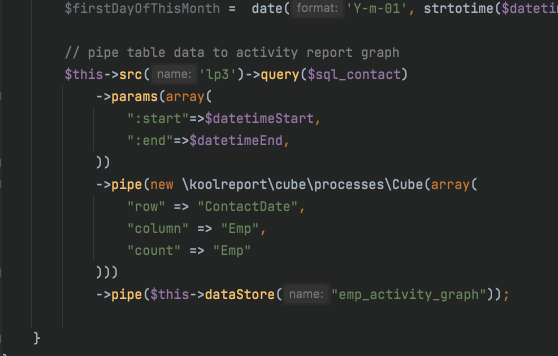
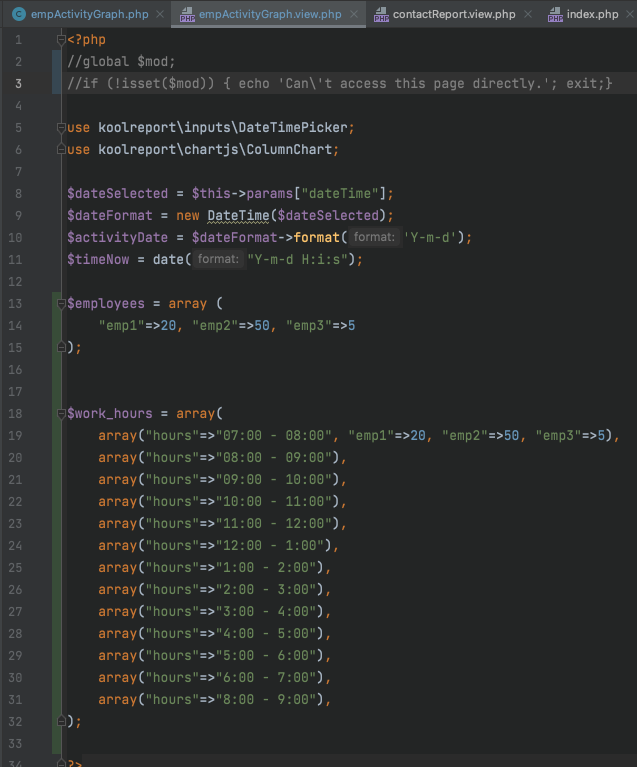
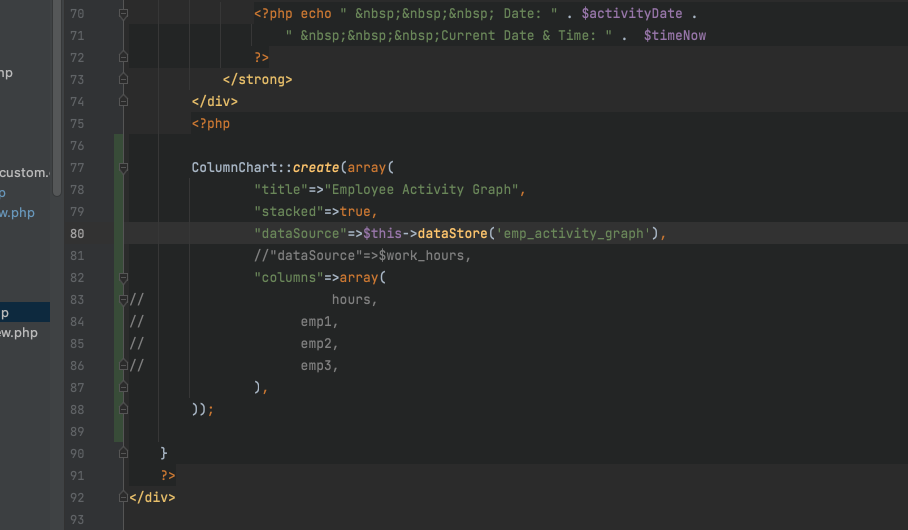
Here is my attempt at trying to setup the column chart

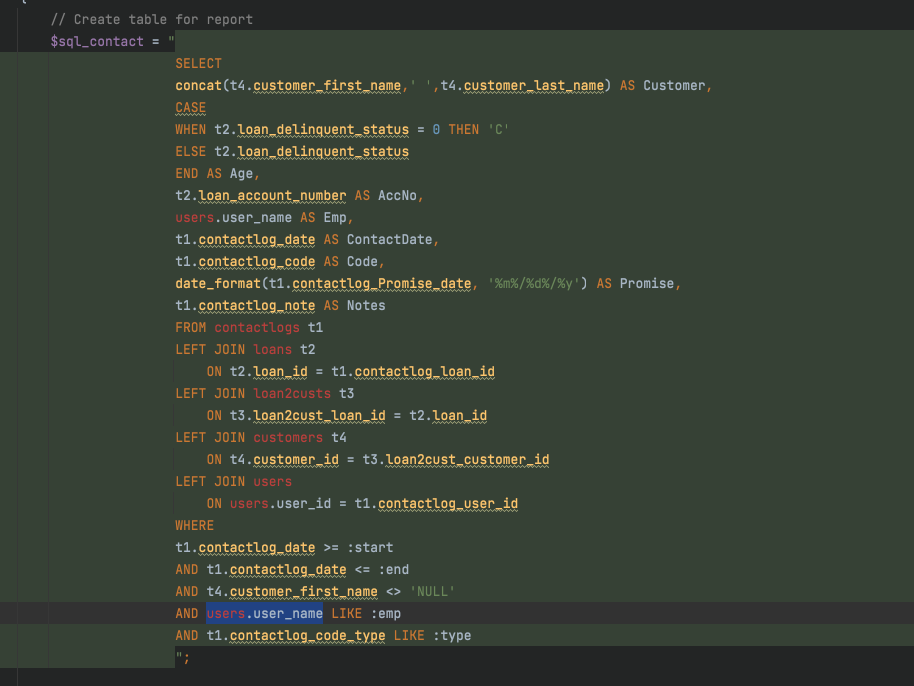
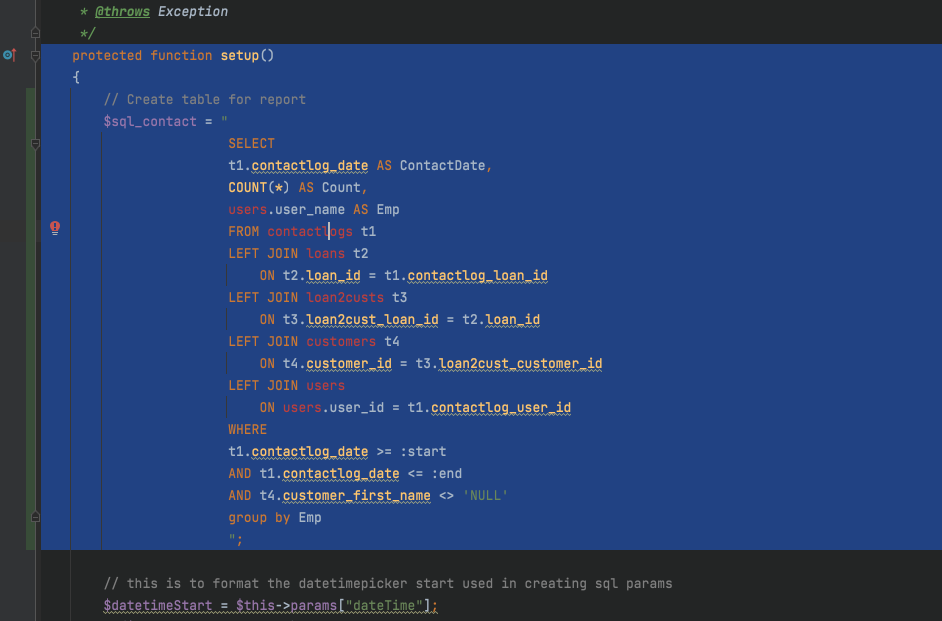
Here is my sql that is not yet working for the right layout of the data

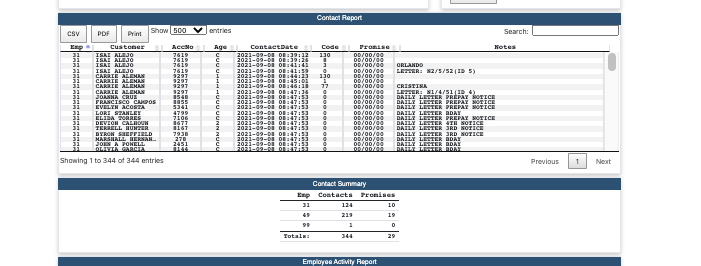
Here is my perfect datatables data showing employees, timestamps during the day. I just at a loss at the moment for how to make the column chart show by hour stacked each employees count of time stamps for the hour.

Here is my sql that produces the datatable above. I only need to have whatever employees were signed in for the day count by the hour of the day the number of time stamps they had for the hour and stack those employees and their counts in the specific hour for my column chart. so a fraction of the data i pull for my datatables I just dont understand this well enough yet and its been a couple of days trying so far.

cfsinc commented on Oct 1, 2021

I will tip for good help on this!!!

Sebastian Morales commented on Oct 4, 2021

Hi, the result you requires is a 2-dimension cube which is pretty hard to do with SQL. Fortunately KoolReport has a super simple process called Cube that should get it for you. Pls use a simple sql query (no GROUP BY clause):

$query = "SELECT ... AS ContactDate, ... AS Emp FROM ...";

Then in your report's setup use Cube process like this:

//MyReport.php
$this->src("database")
->query($query)
->params($params)
->pipe(new \koolreport\cube\processes\Cube(array(
    "row" => "ContactDate",
    "column" => "Emp",
    "count" => "Emp"
)))
->pipe($this->dataStore("EmpDateCount"));

Finally, in your report's view, just use ColumnChart with $this->dataStore("EmpDateCount") as it should contains all the columns and data you want.

Pls try this and let us know if you have any problem. Rgds,

cfsinc commented on Oct 4, 2021

Ok here is where i am at currently with your suggestions

It does separate emp but it also adds in an emp called (all) that is not there. It separates the emps now by color but I still need to stack empoyees by hour of the day. Timestamps from 7am to 8am, from 8am to 9am, from 9am to 10 am. it does seem to add up the timestamps now and show employees separate but how do I get a stacked count of contact times each employee makes by hour of the day. Here is screen shots of all my code in these areas. Also what your changes look like now. I pick the day by calendar so I chose the specific date already in my sql search. If you could even just help me get started on separating by hour examples? I do think this got me a bit closer.

Sebastian Morales commented on Oct 5, 2021

We need to convert the ContactDate field to day and hour. Assuming you're using MySQL we could use this query:

SELECT CONCAT(date(t1.contactlog_date), ' ', hour(t1.contactlog_date) AS 'ContactDateHour' ...

Other databases can have similar functions.

Then we use Cube process like this:

->pipe(new \koolreport\cube\processes\Cube(array(
    "row" => "ContactDateHour",
    "column" => "Emp",
    "count" => "Emp"
)))
->pipe(new \koolreport\processes\RemoveColumn(array(
    "{{all}}" // remove the {{all}}, i.e Total, column
)))
->pipe($this->dataStore("EmpDateCount"));

Pls try this and let us know the result. Tks,

cfsinc commented on Oct 5, 2021

Absolutely awesome support and you guys are brilliant!!! Cant thank you enough for always helping me when I get stuck like this!!!! Many thanks always!!!!!!

Tip Time!!!! Thank You!!!

Build Your Excellent Data Report

Let KoolReport help you to make great reports. It's free & open-source released under MIT license.

Download KoolReport View demo
help needed
solved

ChartJS