KoolReport's Forum

Official Support Area, Q&As, Discussions, Suggestions and Bug reports.
Forum's Guidelines

MultiView Drilldown from Linechart #2362

Closed Niall McGuirk opened this topic on on Sep 29, 2021 - 4 comments

Niall McGuirk commented on Sep 29, 2021

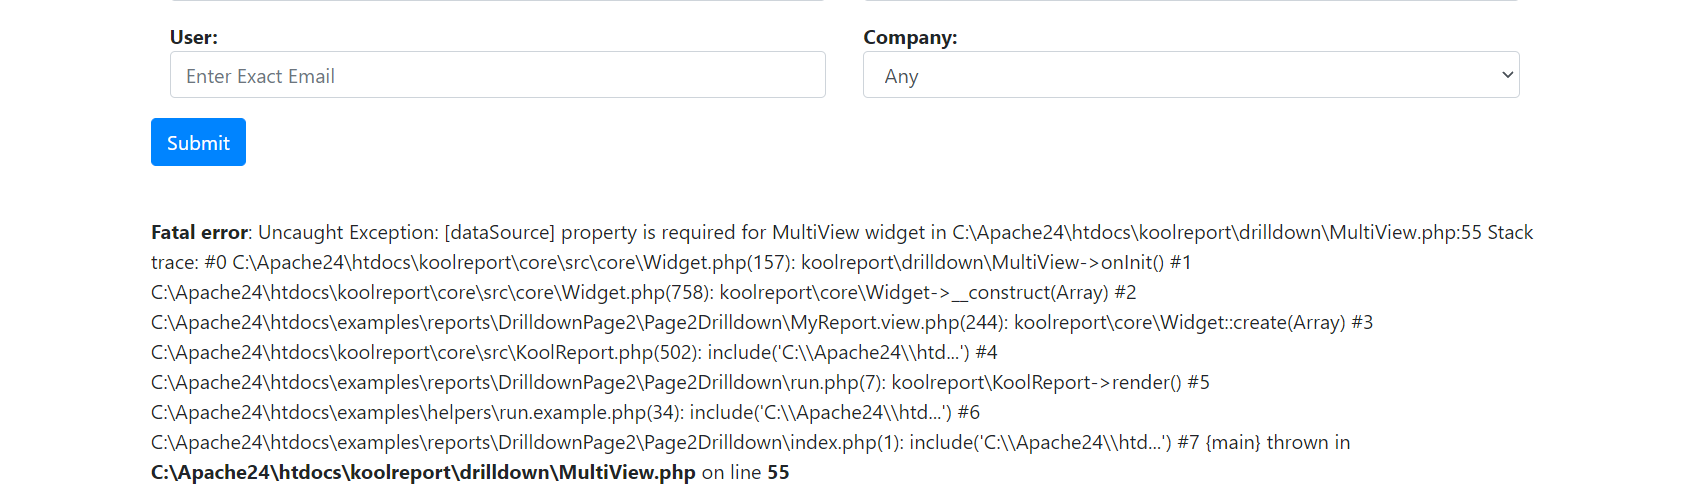
I'm trying to convert a page from simple Line charts, to each being a Linechart which is switchable between Monthly and Version, going between the Weekly and monthly field in the query. I've tried to convert my page, to the example Multiview Drilldown page, but the Syntax seems to be different.

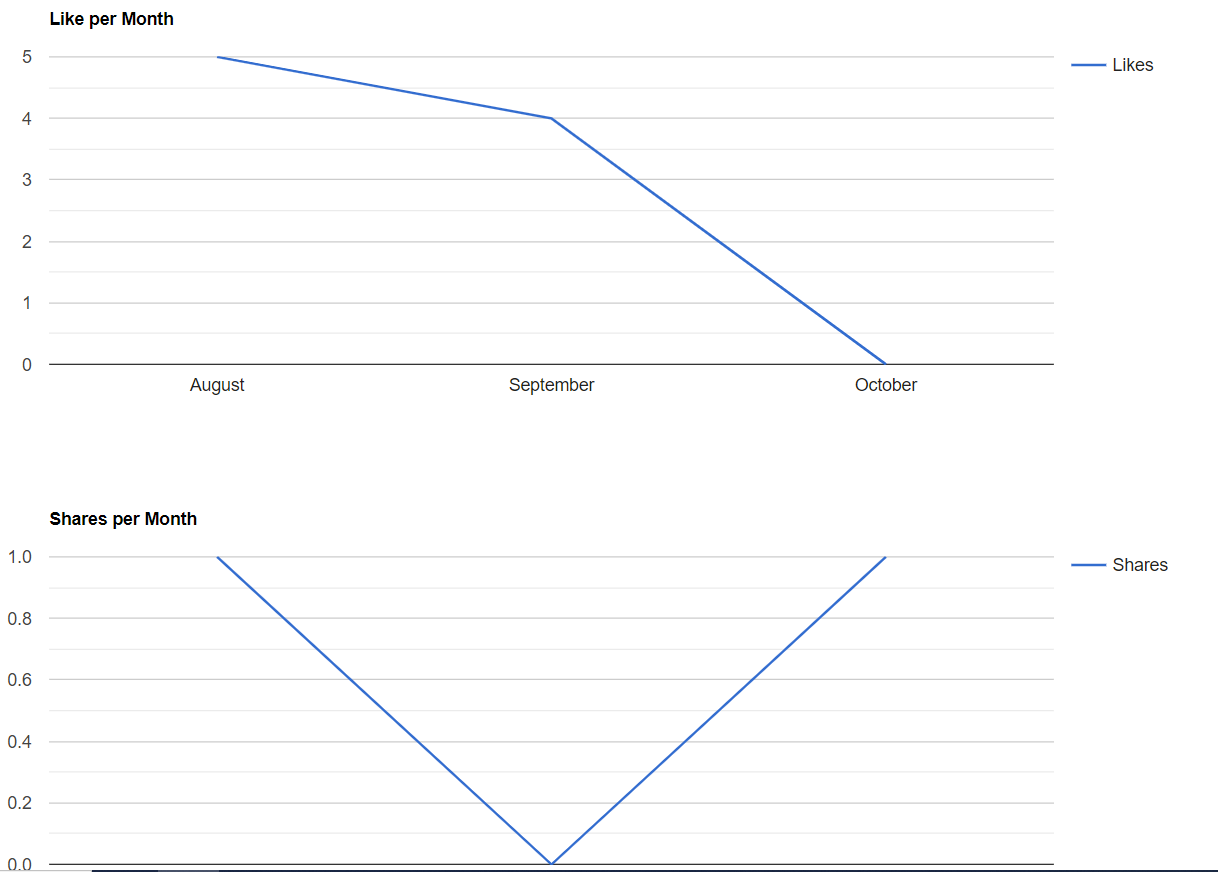
I'm trying to get these linecharts above to become 
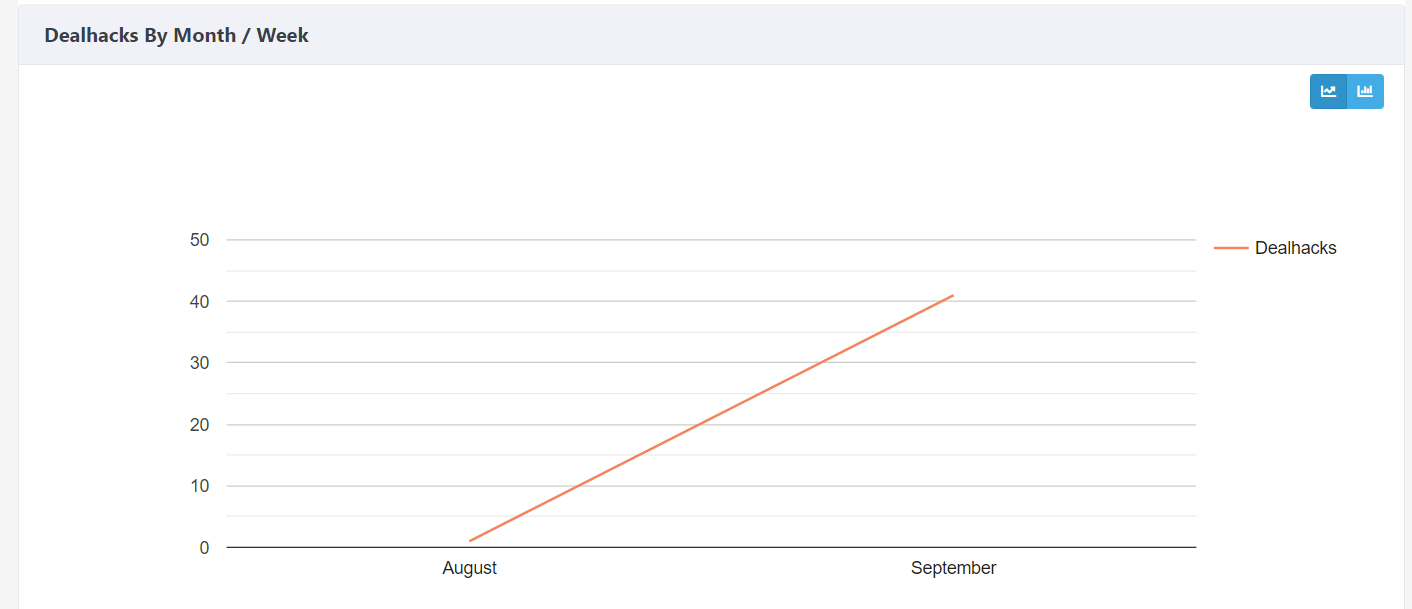
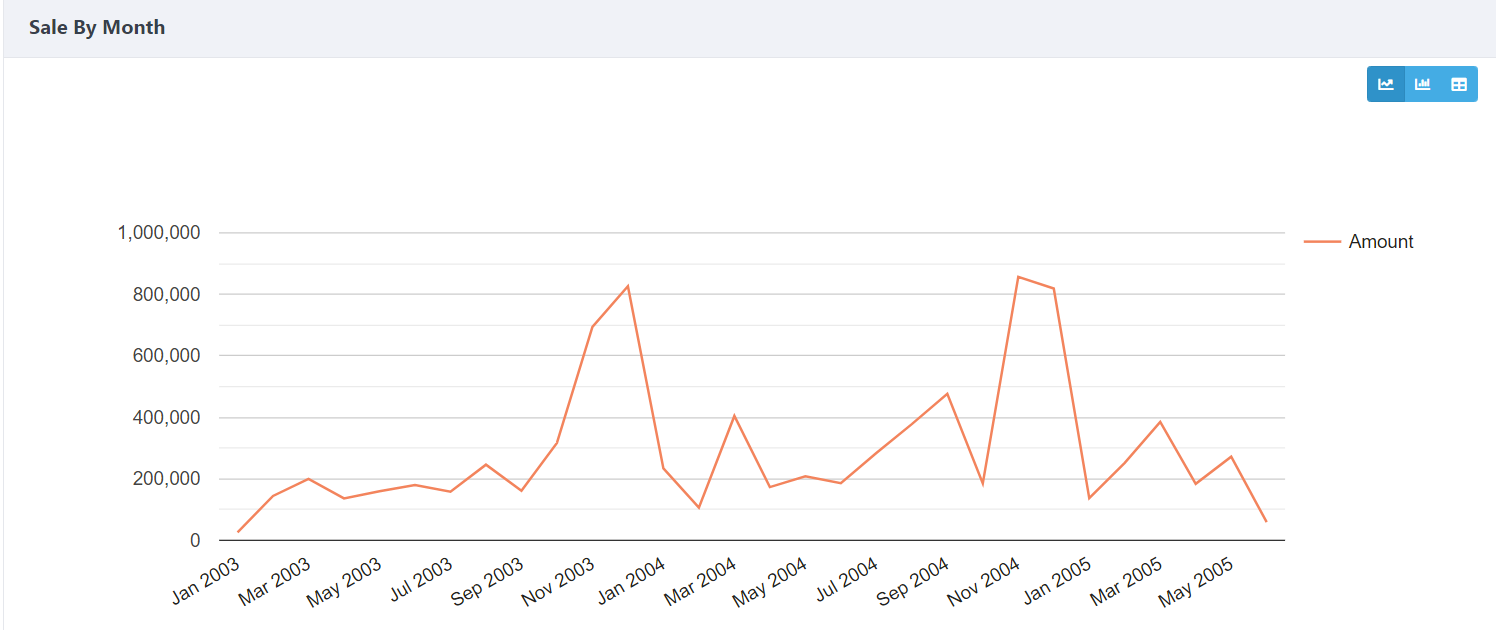
The below format, with two options, to switch between a Monthly and Weekly chart

Here is the Code I'm using from the MyReport.view.php

<?php
    //Graph 1 - Multi View - Dealhacks Per Month/Week
    MultiView::create(array(
        "name"=>"saleMultiView",
        "dataSource"=>$this->dataStore('Graph01'),
        "title"=>"Dealhacks By Month",
        "views"=>array(
            array(
                "handler"=>"<i class='fa fa-line-chart'></i>",
                "widget"=>array(LineChart::class,array(
                    "columns"=>array(
                        "paymentDate"=>array(
                            "label"=>"Payment Time",
                            "type"=>"datetime",
                            "format"=>"Y-m",
                            "displayFormat"=>"M Y",
                        ),
                        "amount"=>array(
                            "prefix"=>'$',
                            "label"=>"Amount"
                        )                                
                    )
                ))
            ),
            
            //LineGraph Graph 1 - Dealhacks per week/month 
            //THIS IS THE ORIGINAL LINECHART CODE, WHICH IM TRYING TO PUT INTO THE ABOVE CODE
                 LineChart::create(array(
                    "title"=>"Deal Hacks per Month",
                    "dataSource"=>$this->dataStore('Graph01'),
                    "columns"=>array(
                        "Month",
                        "Dealhacks"=>array(
                            "label"=>"Dealhacks",
                            "type"=>"number",
                            //"suffix"=>"Test"
                        ),
                    )
                ));//
            
            
            array(
                "handler"=>"<i class='fa fa-bar-chart'></i>",
                "widget"=>array(ColumnChart::class,array(
                    "columns"=>array(
                        "paymentDate"=>array(
                            "label"=>"Payment Time",
                            "type"=>"datetime",
                            "format"=>"Y-m",
                            "displayFormat"=>"M Y",
                        ),
                        "amount"=>array(
                            "prefix"=>'$',
                            "label"=>"Amount"
                        )
                    )
                ))
            ),
            
        )
    ));
    ?> 

This is the code from the MyReport.php which is used by the LineChart

      // GRAPH 1 QUERY - Dealhack Count - New with Filters Version
        $this->src('dealhackdb')->query("Select 
                                         week(created_date) AS 'Week',
                                         monthname(created_date) AS Month,
                                         count(tbl_dealhack.id) AS 'Dealhacks'
                                         From 
                                         tbl_dealhack
                                         left join tbl_profile on tbl_profile.user_id = tbl_dealhack.user_id
                                         Inner join tbl_companytribe on tbl_companytribe.id = tbl_profile.TribeID
                                         Inner Join tbl_company on tbl_company.id = tbl_profile.CompanyID 
                                         left join tbl_category on tbl_category.id = tbl_dealhack.category_id
                                         WHERE  1=1
                                         
                 "
                .(($this->params["startDatePicker"]!=array())?"AND created_date BETWEEN (:start) ":"").""
                .(($this->params["endDatePicker"]!=array())?" AND (:end) ":"").""
                .((($this->params["select"]!='Any'))?"AND TribeName LIKE (:tribe) ":"").""
                .((($this->params["dealhack"]!='Any'))?"AND category = (:dealhack) ":"").""
                .((($this->params["companySelector"]!='Any'))?"AND Company LIKE (:company) ":"").""
                .((($this->params["user"]!=''))?"AND email = (:user) ":"")." Group By Monthname(created_date) Order by created_date"
               )
        ->params($query_params)
        ->pipe($this->dataStore("Graph01"));
        //dataStore with filters, is Graph0x
Sebastian Morales commented on Sep 30, 2021

Niall, I think you should pipe the data for each chart into a different datastore and use it as "dataSource" for each chart widget instead of using a common datastore from the Multiview. So the syntax should be:

MultiView::create(array(
        "name"=>"saleMultiView",        
        "title"=>"Dealhacks By Month",
        "views"=>array(
            array(
                "handler"=>"<i class='fa fa-line-chart'></i>",
                "widget"=>array(LineChart::class,array(
                    "dataSource"=>$this->dataStore('LineChartDataStore'),
                    "columns"=>array(
                        "paymentDate"=>array(
                            "label"=>"Payment Time",
                            "type"=>"datetime",
                            "format"=>"Y-m",
                            "displayFormat"=>"M Y",
                        ),
                        "amount"=>array(
                            "prefix"=>'$',
                            "label"=>"Amount"
                        )                                
                    )
                ))
            ), 
            ...

If there's any problem let us know. Tks,

Niall McGuirk commented on Sep 30, 2021

I've added your code, and put in the datasource from MyReport.php Linechart. I've got the following error:

Here is the current code from MyReport.view:

  <?php


//BELOW IS THE CODE FROM YOUR POST
           MultiView::create(array(
        "name"=>"saleMultiView",        
        "title"=>"Dealhacks By Month",
        "views"=>array(
            array(
                "handler"=>"<i class='fa fa-line-chart'></i>",
                "widget"=>array(LineChart::class,array(
                    "dataSource"=>$this->dataStore('Graph01'),
                    "columns"=>array(
                        "Month"=>array(
                            "label"=>"Month",
                            "type"=>"datetime",
                            "format"=>"Y-m",
                            "displayFormat"=>"M Y",
                        ),
                        "Dealhacks"=>array(
                            "prefix"=>'',
                            "label"=>"Dealhacks"
                        )                                
                    )
                ))
            ), 


           // MY ORIGINIAL GRAPH, WHICH IM TRYING TO MAKE MULTIVIEW
//            //LineGraph Graph 1 - Dealhacks per week/month 
//                 LineChart::create(array(
//                    "title"=>"Deal Hacks per Month",
//                    "dataSource"=>$this->dataStore('Graph01'),
//                    "columns"=>array(
//                        "Month",
//                        "Dealhacks"=>array(
//                            "label"=>"Dealhacks",
//                            "type"=>"number",
//                            //"suffix"=>"Test"
//                        ),
//                    )
//                ));
            
            //PART OF EXAMPLE MULTIVIEW CODE
            array(
                "handler"=>"<i class='fa fa-bar-chart'></i>",
                "widget"=>array(ColumnChart::class,array(
                    "columns"=>array(
                        "paymentDate"=>array(
                            "label"=>"Payment Time",
                            "type"=>"datetime",
                            "format"=>"Y-m",
                            "displayFormat"=>"M Y",
                        ),
                        "amount"=>array(
                            "prefix"=>'$',
                            "label"=>"Amount"
                        )
                    )
                ))
            ),
            
        )
    ));
    ?> 

Here is the datasource from MyReport.php, This data source connects the input filters to the Graph

      // GRAPH 1 QUERY - Dealhack Count - New with Filters Version
        $this->src('dealhackdb')->query("Select 
                                         week(created_date) AS 'Week',
                                         monthname(created_date) AS Month,
                                         count(tbl_dealhack.id) AS 'Dealhacks'
                                         From 
                                         tbl_dealhack
                                         left join tbl_profile on tbl_profile.user_id = tbl_dealhack.user_id
                                         Inner join tbl_companytribe on tbl_companytribe.id = tbl_profile.TribeID
                                         Inner Join tbl_company on tbl_company.id = tbl_profile.CompanyID 
                                         left join tbl_category on tbl_category.id = tbl_dealhack.category_id
                                         WHERE  1=1
                                         
                 "
                .(($this->params["startDatePicker"]!=array())?"AND created_date BETWEEN (:start) ":"").""
                .(($this->params["endDatePicker"]!=array())?" AND (:end) ":"").""
                .((($this->params["select"]!='Any'))?"AND TribeName LIKE (:tribe) ":"").""
                .((($this->params["dealhack"]!='Any'))?"AND category = (:dealhack) ":"").""
                .((($this->params["companySelector"]!='Any'))?"AND Company LIKE (:company) ":"").""
                .((($this->params["user"]!=''))?"AND email = (:user) ":"")." Group By Monthname(created_date) Order by created_date"
               )
        ->params($query_params)
        ->pipe($this->dataStore("Graph01"));
        //dataStore with filters, is Graph0x
Sebastian Morales commented on Oct 1, 2021

I see, maybe still set "dataSource" for MultiView widget while using individual datastore for each Chart/Table inside. Let me know if there's still any issue. Tks,

Niall McGuirk commented on Oct 1, 2021

I have made it work. Thanks for the help. For future reference here is the working code. However the datasource about the widget seems to be redundant, as it uses the datasource in the Multiview array.

 //Graph 2.1 - Multi View - Likes Per Month/Week
    MultiView::create(array(
        "name"=>"saleMultiView",
        "dataSource"=>$this->dataStore('Graph02'),
        "title"=>"Likes By Month / Week",
        "views"=>array(
            array(
                "handler"=>"<i class='fa fa-line-chart'></i>",
                  "dataSource"=>$this->dataStore('Graph02'),
                "widget"=>array(LineChart::class,array(
                    "columns"=>array(
                        "Month"=>array(
                            "label"=>"Month",
                            "type"=>"datetime",
                            "format"=>"Y-m",
                            "displayFormat"=>"M Y",
                        ),
                        "Likes"=>array(
                            "type"=>"number",
                            //"prefix"=>'$',
                            "label"=>"Likes"
                        )                                
                    )
                ))
            ),
            array(
                "handler"=>"<i class='fa fa-bar-chart'></i>",
                "dataSource"=>$this->dataStore('Graph02'),
                "widget"=>array(LineChart::class,array(
                    "columns"=>array(
                        "Week"=>array(
                            "label"=>"Week",
                            "type"=>"datetime",
                            "format"=>"Y-m",
                            "displayFormat"=>"M Y",
                        ),
                        "Likes"=>array(
                            "type"=>"number",
                            //"prefix"=>'$',
                            "label"=>"Likes"
                        )
                    )
                ))
            ),
            
        )
    ));
   

Build Your Excellent Data Report

Let KoolReport help you to make great reports. It's free & open-source released under MIT license.

Download KoolReport View demo
help needed
solved

DrillDown