KoolReport's Forum

Official Support Area, Q&As, Discussions, Suggestions and Bug reports.
Forum's Guidelines

BarChart with two group and legend #2356

Open Anna Tolve opened this topic on on Sep 24, 2021 - 2 comments

Anna Tolve commented on Sep 24, 2021

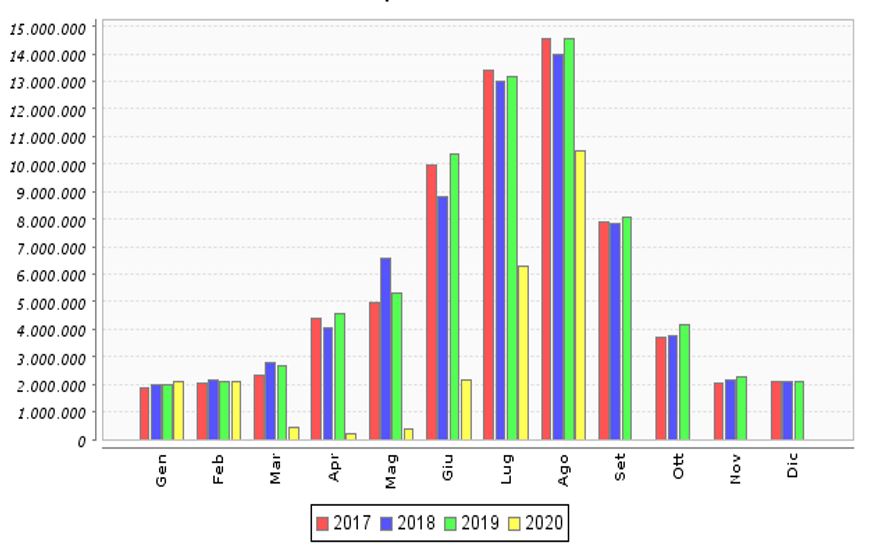
is it possible to get a chart like this?

I only managed to get this:

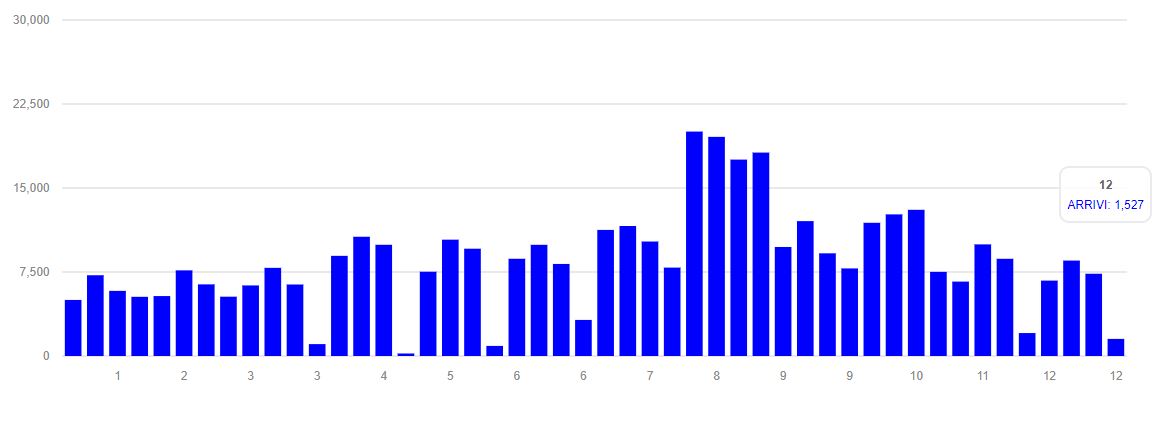
here is my code using morris_chart\Bar

                        Bar::create(array(
			"title"=>"ARRIVI",
			"dataSource"=>$this->dataStore("result"),
			"colorScheme"=>array("blue", "yellow", "black", "green"),
			"columns"=>array(
				"MESE"=>array(
					"formatValue"=>function($value, $row){
						switch ($value) {		
							case $value==1 : return "Gennaio"; break;
							case $value==2 : return "Febbraio"; break;
							case $value==3 : return "Marzo"; break;
							case $value==4 : return "Aprile"; break;
							case $value==5 : return "Maggio"; break;
							case $value==6 : return "Giugno"; break;
							case $value==7 : return "Luglio"; break;
							case $value==8 : return "Agosto"; break;
							case $value==9 : return "Settembre"; break;
							case $value==10 : return "Ottobre"; break;
							case $value==11 : return "Novembre"; break;
							case $value==12 : return "Dicembre"; break;					
							}
						}
					),
				"ARRIVI"=>array(
					"type"=>"number",
					"thousandSeparator"=>"."
				)
			)
		));
Sebastian Morales commented on Sep 27, 2021

Anna, to display a chart like your first picture you have to change your datastore's data structure. It should have the first column as "Month" column and the next 4 columns are 2017, 22018, 2019, 2020 columns. Then each data row has month name and 2017, 2018, 2019, and 2020 values:

Month 2017 2018 2019 2020
January 999 921 953 929
February 575 548 583 517
... ... ... ... ...
Anna Tolve commented on Sep 28, 2021

Thanks a lot Sebastian, it worked! :)

Build Your Excellent Data Report

Let KoolReport help you to make great reports. It's free & open-source released under MIT license.

Download KoolReport View demo
solved

None