I have a dashboard which shows values, and uses inputs to filter the data displayed on the graphs. I'm currently filtering between two dates and the data is shown by month, by selecting a count for each month, in the sql.
I'm wondering if there is some feature included in Kool Reports that would allow the user to switch between showing the graph data by month, and week? Perhaps a button on the corner of the graph.
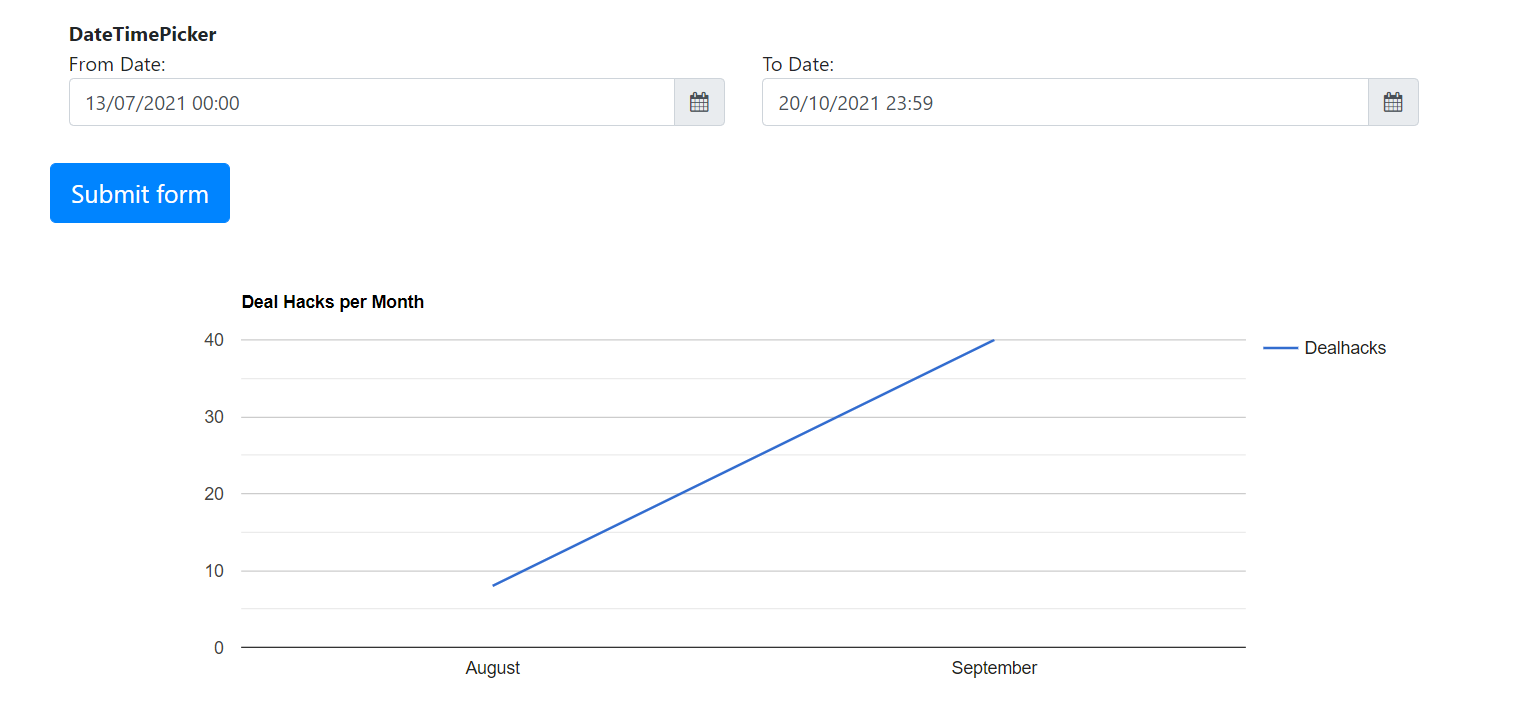
This is the format of the query in the dataStore, so would I be possible to show on graph then show another with a selector. I'm not sure if this exists in Kool Reports, but I wanted to check.
$this->src('dealhackdb')->query("Select
                                         /*week(created_date) AS 'Week', */
                                         monthname(created_date) AS Month,
                                         count(tbl_dealhack.id) AS 'Dealhacks'
                                         From
                                         tbl_dealhack
                                         left join tbl_profile on tbl_profile.user_id = tbl_dealhack.user_id
                                         Inner join tbl_companytribe on tbl_companytribe.id = tbl_profile.TribeID
                                         Inner Join tbl_company on tbl_company.id = tbl_profile.CompanyID
                                         left join tbl_category on tbl_category.id = tbl_dealhack.category_id
                                         WHERE  created_date BETWEEN :start AND :end
                                         Group By Monthname(created_date)
                                         -- where user_id =
                                        --  TribeID =
                                        -- company =
                                        --  category =
                                        -- created_date BETWEEN :start AND :end
                                        Order by created_date

                                        ;
")->params(array(
            ":start"=>$this->params["startDatePicker"],
             ":end"=>$this->params["endDatePicker"]))
             ->pipe($this->dataStore("Graph1"));
Update
Would it be possible to use the Multiview feature in KoolReports to Switch between Monthly and Weekly versions of the same graph?