Ok I get it, I need a crosstab, so I generated that crosstab like this:
SELECT Month, [Water Bill] as Water, [Power Bill] as Power, [Gas Bill] as Gas
FROM
(
SELECT Month, ExpenseType, Cost
FROM dbo.qryIntranet_WebApplication_Reports_StationExpenses
) exp
PIVOT
(
Sum(Cost) For ExpenseType in ([Water Bill] , [Power Bill], [Gas Bill] )
) as pvt
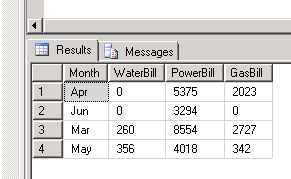
The results are:
Month Water Power Gas
Apr NULL 5375 2023
Jun NULL 3294 NULL
Mar 260 8554 2727
May 356 4018 342
I still get the error "Data column(s) for axis #0 cannot be of type string×"
I thought this might be problems with null values so i selected those out in the subquery but sitll got that issue.
What am I missing? With that asked I'm also trying to add a dropdown filter option for month and stationame so I added station name to the cross tab and returned:
Month StationName Water Power Gas
Apr Garage NULL 723 769
Jun Garage NULL 613 NULL
Apr Black River NULL 289 NULL
Mar Black River NULL 345 NULL
May Black River NULL 282 NULL
so first and foremost after crosstab i still have the same error, and secondly i'd like to add station name to the chart and html dropdowns to filter the graph by those values assuming i get it working
Thanks for all the support!