KoolReport's Forum

Official Support Area, Q&As, Discussions, Suggestions and Bug reports.
Forum's Guidelines

Y axis format #2202

Open pcalderon opened this topic on on Jul 12, 2021 - 5 comments

pcalderon commented on Jul 12, 2021

Hi, I would like to format the y-axis on drilldown component. I need to replace the thousandth separator and remove decimals. I tried with the code below, but it does not work. "yAxis"=>array(

        "decimals"=>0,
        "decPoint"=>"",
        "thousandSep"=>".",
        "prefix"=>"",
        "suffix"=>""
    )

Thanks in advance

Sebastian Morales commented on Jul 13, 2021

Did you mean formating a chart's y-axis inside a Drilldown? If you did, what was the chart package you used and pls post the chart's create code. Tks,

pcalderon commented on Jul 13, 2021

Hi, I am using KoolreportPro 5.7.0. Below my code and the result is in the attached image. Thanks.

<?php

use \koolreport\drilldown\DrillDown;
use \koolreport\widgets\google\ColumnChart;

?> <div class="report-content">

<div class="text-center">
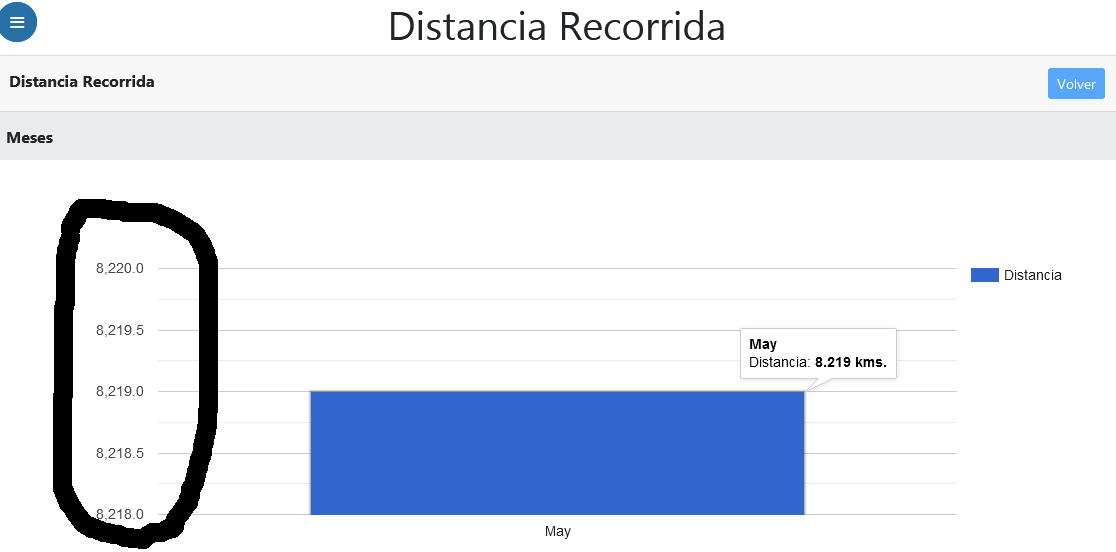
    <h1>Distancia Recorrida</h1>
</div>

<?php
require_once __DIR__."/../htmlHeader.php";
DrillDown::create(array(
    "yAxis"=>array(
        "decimals"=>0,
        "decPoint"=>"",
        "thousandSep"=>".",
        "prefix"=>"",
        "suffix"=>""
    ),
    "name"=>"saleDrillDown",
    "title"=>"Distancia Recorrida",
    "btnBack"=>array("text"=>"Volver"),
    "levels"=>array(
        array(
            "title"=>"Meses",
            "content"=>function($params,$scope)
            {
                ColumnChart::create(array(
                    "dataSource"=>(
                        $this->src("default")->query("
                        SELECT MONTHNAME(BLAH.date) as myDate,  CONCAT(MONTHNAME(BLAH.date)) AS myPeriod, BLAH.mySum, SB.name AS entityDescription
                        FROM(SELECT DATE , companyId,  ROUND(SUM(distanceByGps)/1000) AS mySum   FROM distanceTraveledMonthly WHERE companyId IN(3) GROUP BY 1,2) BLAH
                        JOIN cm_sam_db_V2.sam_company SB ON BLAH.companyId = SB.id
                        ")
                    ),
                    "columns"=>array(
                        "myPeriod"=>array(
                            "type"=>"string",
                            "label"=>"Mes",
                        ),
                        "mySum"=>array(
                            "label"=>"Distancia",
                            "type"=>"number",
                            'formatValue'=>function($value)
                            {
                               return number_format(
                                     $value,
                                     0,
                                     "",
                                     "."
                                )." kms.";
                            }
                        )
                    ),
                    "clientEvents"=>array(
                        "itemSelect"=>"function(params){
                            saleDrillDown.next({year:params.selectedRow[0]});
                        }",
                    )
                ));
            }
        )

    ),
    "themeBase"=>"bs4",
));
?> 

</div>

result

Sebastian Morales commented on Jul 14, 2021

Pls try to set those properties for the column meta (assuming "mySum") instead of y axis:

                        "mySum"=>array(
                            "label"=>"Distancia",
                            "type"=>"number",
                            "decimals"=>0,
                            "decPoint"=>"",
                            "thousandSep"=>".",
                            "prefix"=>"",
                            "suffix"=>""
                        )

Let us know how it works for you. Tks,

pcalderon commented on Jul 15, 2021

hi. It does not work. Same result. Any other solution?

Tanks.

Sebastian Morales commented on Jul 16, 2021

Ok, pls try this directly on the Google Charts' create:

    ColumnChart::create(array(
        ...
        "options" => array(
            "vAxis" => array(
                "format" => $prefix . "#" . $suffix
            )                                
        )
    ));        

This would set the number of decimals = 0.

For thousand separator Google Charts decides it based on languagure, which is "en" by default. You could try other language like this:

    ColumnChart::create(array(
        ...
        "language" => "fr", // "es", "de", etc
    ));      

Build Your Excellent Data Report

Let KoolReport help you to make great reports. It's free & open-source released under MIT license.

Download KoolReport View demo
help needed

DrillDown