KoolReport's Forum
Official Support Area, Q&As, Discussions, Suggestions and Bug reports.
Forum's Guidelines
Name/title of axes of Column and Barchart #2156
Yes, I am aware of the default labelling. What I want to implement is when you chart year (horizontal axis) against amount (vertical axis). I want to indicate on the vertical axis say "total sales" in addition to the amount (figures) that are represented. On the horizontal axis also to indicate say "Years of operation" in addition to the years (2017, 2018, 2019, 2020). I hope my illustration is okay. Thank you.
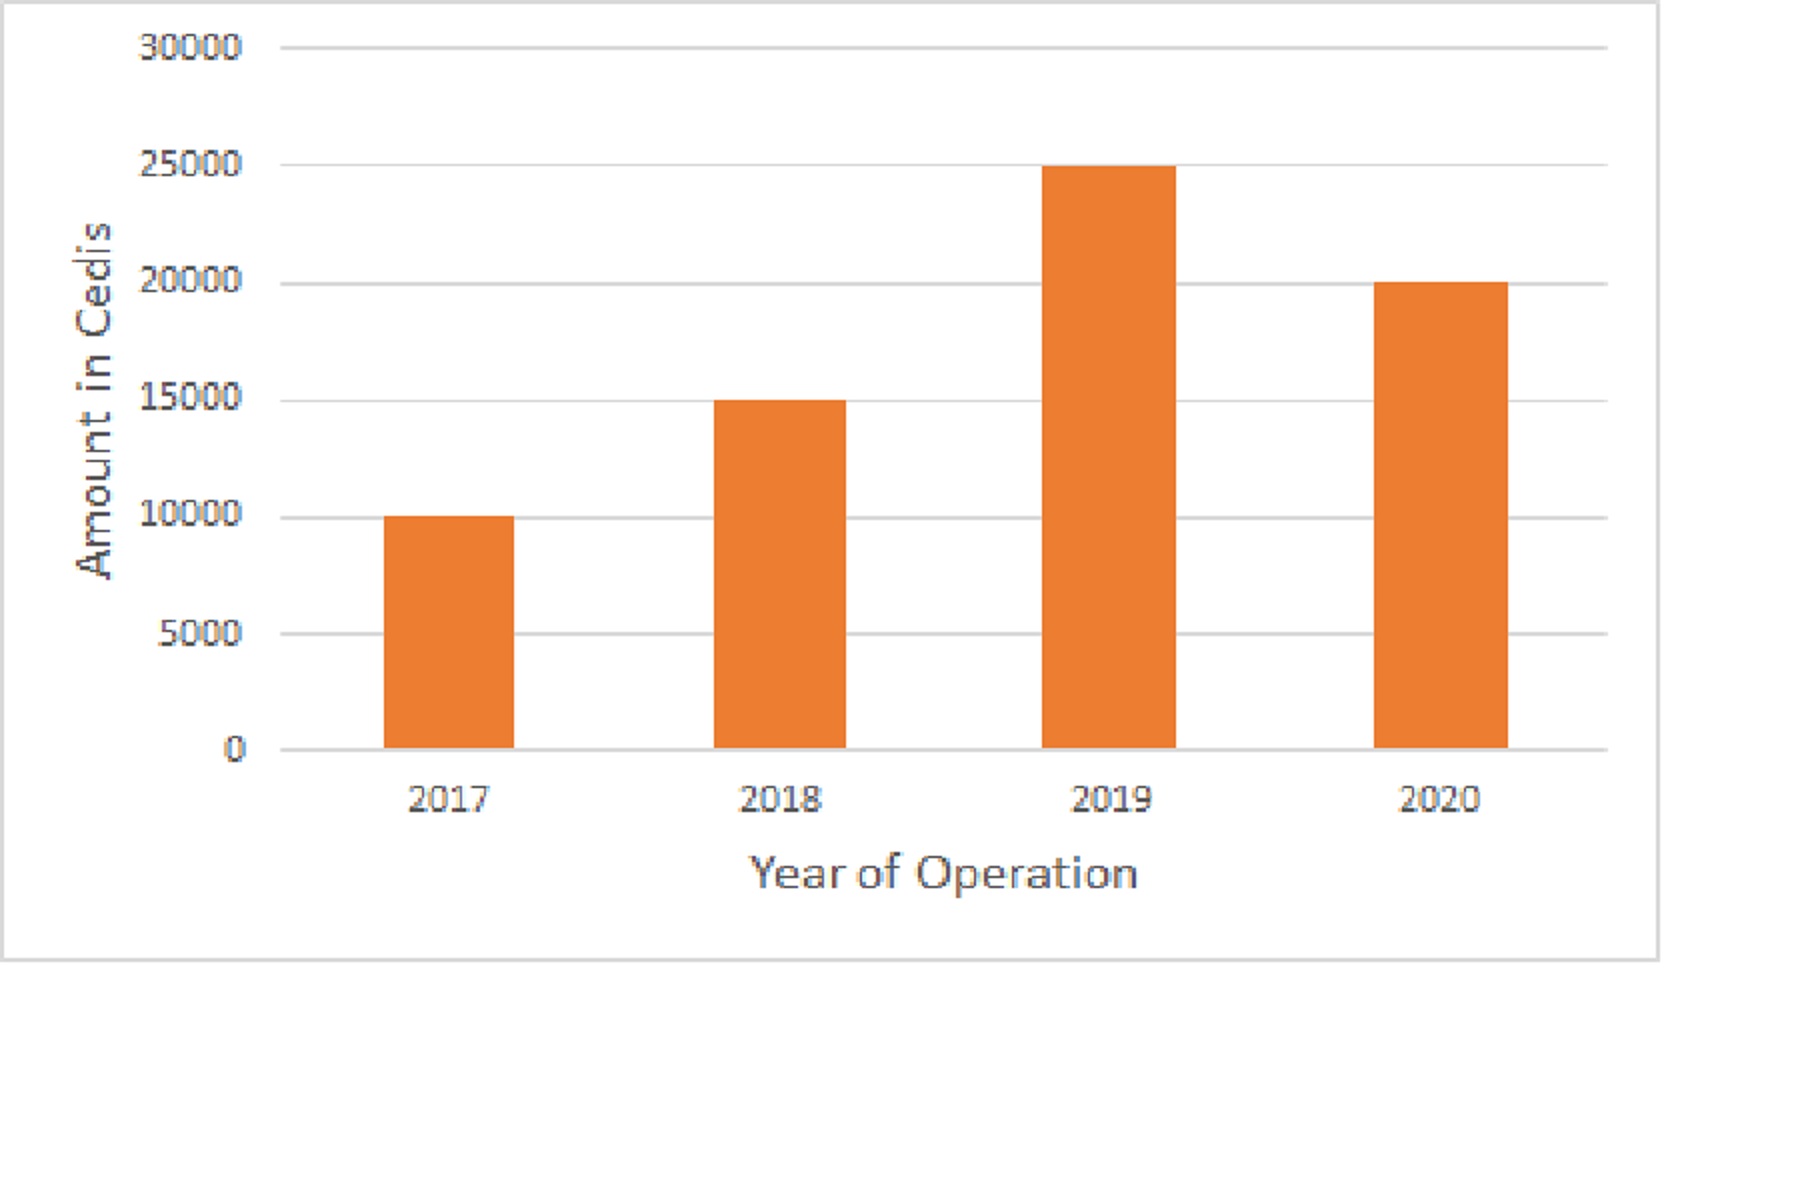
Oh, I see. If you use Google Charts pls try the hAxis/vAxis title property like this:
    BarChart::create(array(
        ...
        "options" => array(
            ...
            "hAxis" => array(
                "title" => "Total Sales",
                ...
            ),
            "vAxis" => array(
                "title" => "Years of Operation",
                ...
            )
If you use another chart package let us know. Tks,
Build Your Excellent Data Report
Let KoolReport help you to make great reports. It's free & open-source released under MIT license.
Download KoolReport View demo