KoolReport's Forum

Official Support Area, Q&As, Discussions, Suggestions and Bug reports.
Forum's Guidelines

How to join multiple tables in dashboard for google charts #2127

Closed Abhishek opened this topic on on Jun 7, 2021 - 3 comments

Abhishek commented on Jun 7, 2021

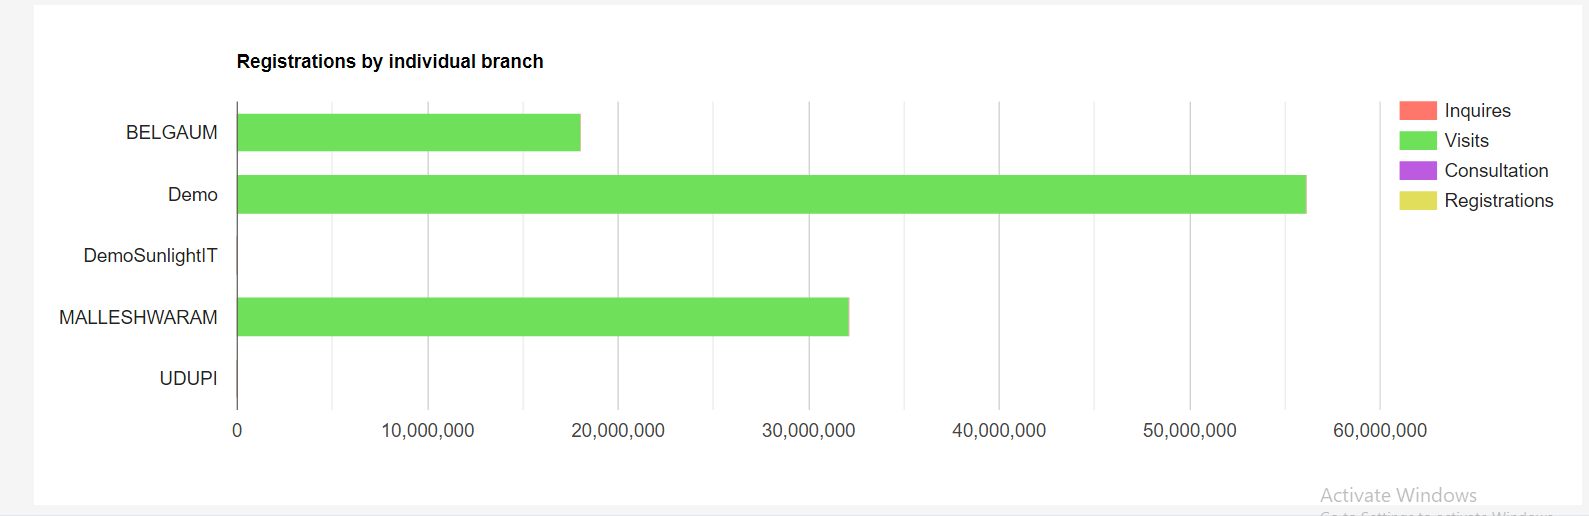
Dear Team, Thanks for the solutions and I do have any other query that is I have implemented a column chart in the dashboard but there are some of the conditions that need to satisfy.

  1. Count of inquiries, appointments, visits, and consultations based on individual branches need to be shown in the chart.

  2. I need to join data from different tables like branches from table branch, inquiries from table customer inquiries.

  3. appointments, visits, and consultations from table consultations.

So, can you please help me with how to join the three tables(branch, customer inquiries, consultations) and need to show the count data of inquiries, appointments, visits, and consultations based on individual branches.

I have used only one table in my code but i need to join 3 tables as specified above please help me on how join them.

Branchdata.php

<?php
use \koolreport\dashboard\widgets\google\BarChart;
//use \koolreport\dashboard\fields\Date;
use \koolreport\dashboard\fields\Text;
use \koolreport\dashboard\fields\Number;


class branchdata extends BarChart
{
	protected function onCreated()
    {
        $this
        ->title("Registrations by individual branch")
        ->options([
            "isStacked"=>true
        ]);
        //->colorScheme(["#000","#444","#888"])
        //->height("320px");
    }
	
    protected function dataSource()
    {
        return AutoMaker::table("tblcustomerenquiries")
                ->groupBy("custBranchId")
                ->select("custBranchId")
                ->sum("custRegistrationId")->alias("registrations")
				->sum("custEnquiryId")->alias("inquires");
    }

    protected function fields()
    {
        return [
            Number::create("custBranchId"),
            Number::create("registrations"),
			Number::create("inquires"),
        ];
    }
}
KoolReport commented on Jun 7, 2021

The the dataSource() we use the QueryBuilder, you can have a look at our documentation here for join query:

Join query of QueryBuilder

Hope that helps.

Abhishek commented on Jun 7, 2021

Dear Team, Thanks for the solution and I have joined the table successfully.

But It is showing the data of only visits but it need to show the data of registrations, enquires and Consultations. ​

As shown in the below example

In example one book and individual sale, cost and profit.

In my case one branch and individual registrations, visits, enquires and Consultations. But my output is below

<?php
use \koolreport\dashboard\widgets\google\BarChart;
//use \koolreport\dashboard\fields\Date;
use \koolreport\dashboard\fields\Text;
use \koolreport\dashboard\fields\Number;


class branchdata extends BarChart
{
	protected function onCreated()
    {
        $this
        ->title("Registrations by individual branch")
        ->options([
            "isStacked"=>true
        ]);
        //->colorScheme(["#000","#444","#888"])
        //->height("320px");
    }
	
    protected function dataSource()
    {
        return AutoMaker::table("tblcustomerenquiries")
		->join('tblbranch', 'tblcustomerenquiries.custBranchId', '=', 'tblbranch.brnchId')
		->join('tblconsultation', 'tblcustomerenquiries.custEnquiryId', '=', 'tblconsultation.enquiryid')
                ->groupBy("tblbranch.brnchName")
                ->select("tblbranch.brnchName")
				->sum("tblcustomerenquiries.custEnquiryId")->alias("Inquires")
				->sum("tblconsultation.visitId")->alias("Visits")
				->sum("tblconsultation.consultId")->alias("Consultations")
				 ->sum("tblcustomerenquiries.custRegistrationId")->alias("Registrations");
				
    }

    protected function fields()
    {
        return [
            Text::create("brnchName"),
			Number::create("inquires"),
			Number::create("Visits"),
			Number::create("consultation"),
            Number::create("registrations"),	
        ];
    }
}
Abhishek commented on Jun 9, 2021

Dear Team, Please cloud you provide the solution for the above problem.

Build Your Excellent Data Report

Let KoolReport help you to make great reports. It's free & open-source released under MIT license.

Download KoolReport View demo
help needed

Dashboard