Okay...
<?php
use koolreport\d3\ColumnChart;
$data =
[
[
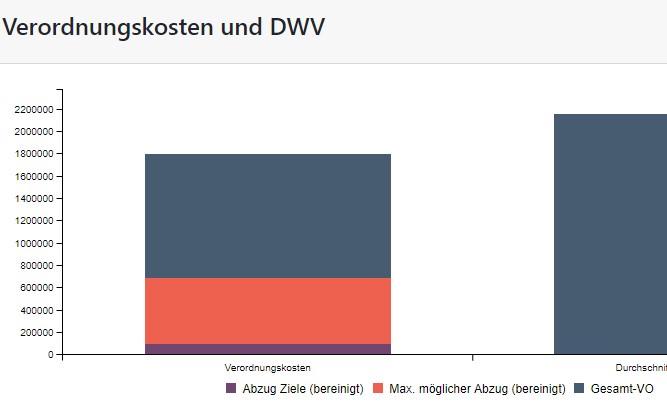
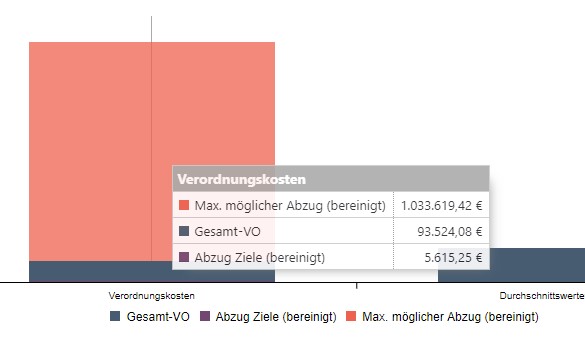
'category' => 'Verordnungskosten',
'Erreichte Ziele' => $this->dataStore('ZqData1')->sum('erf_bereinigung'),
'Alle Ziele erreicht' => $this->dataStore('ZqData1')->sum('opt_bereinigung'),
'VO-Kosten' => $this->dataStore('PvbDwv')->sum('vk') - $this->dataStore('ZqData1')->sum('erf_bereinigung') - $this->dataStore('ZqData1')->sum('opt_bereinigung'),
],
[
'category' => 'Durchschnittswertevolumen',
'VO-Kosten' => $this->dataStore('PvbDwv')->sum('dwv'),
'Erreichte Ziele' => 0,
'Alle Ziele erreicht' => 0,
],
];
ColumnChart::create([
'dataSource' => $data,
'columns' => [
'category',
'VO-Kosten' => [
'label' => 'Gesamt-VO ',
'type' => 'number',
'suffix' => ' €',
"decimals" => 2,
"decPoint" => ",",
"thousandSep" => ".",
],
'Erreichte Ziele' => [
'label' => 'Abzug Ziele (bereinigt)',
'type' => 'number',
'suffix' => ' €',
"decimals" => 2,
"decPoint" => ",",
"thousandSep" => ".",
],
'Alle Ziele erreicht' => [
'label' => 'Max. möglicher Abzug (bereinigt)',
'type' => 'number',
'suffix' => ' €',
"decimals" => 2,
"decPoint" => ",",
"thousandSep" => ".",
],
],
'stacked' => true,
'colorScheme' => ['#475C71', '#714771', '#EE614F']
]);