KoolReport's Forum

Official Support Area, Q&As, Discussions, Suggestions and Bug reports.
Forum's Guidelines

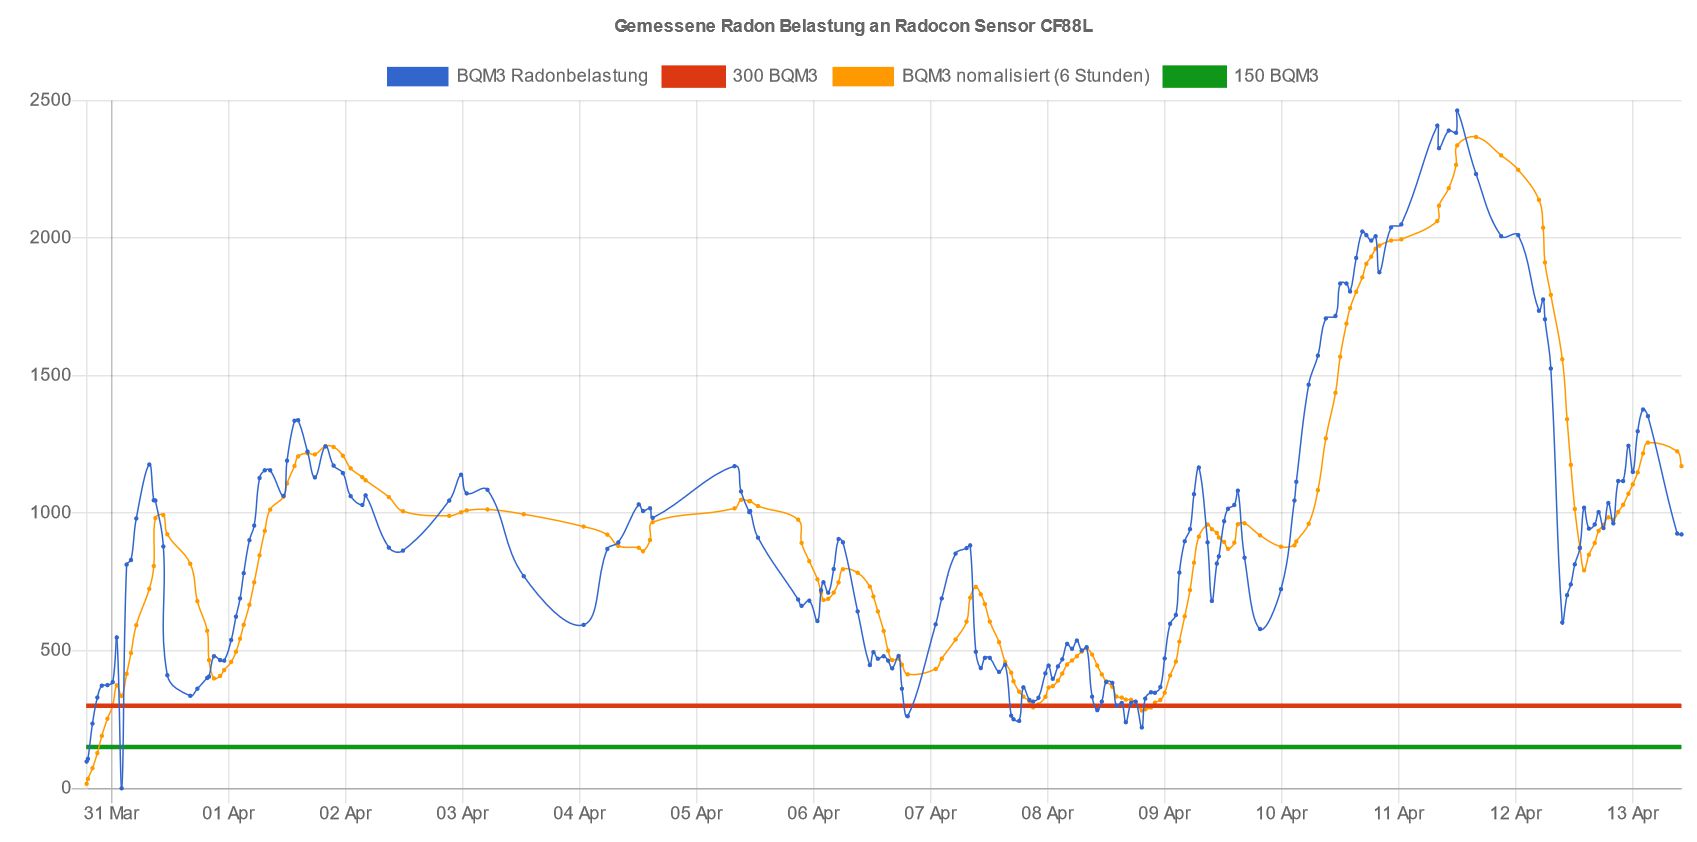
ChartJS show one date tick per day on axis #2020

Closed Frank Wolf opened this topic on on Apr 9, 2021 - 2 comments

Frank Wolf commented on Apr 9, 2021

Hi, need help to show one tick per date on axis. Regards, Frank

<?php
LineChart::create(array(
        "title"=>"Gemessene Radon Belastung an Radocon Sensor ".$sensor,
        "dataSource"=>$a,
        "columns"=>array(
             "DT",
            "BQM3"=>array(
             ...
            ),
             "MAX"=>array(
             ...
            ),
            "HD"=>array(
            ...
            ),
            "OK"=>array(
            ...
            ),
        )
    ));
?>
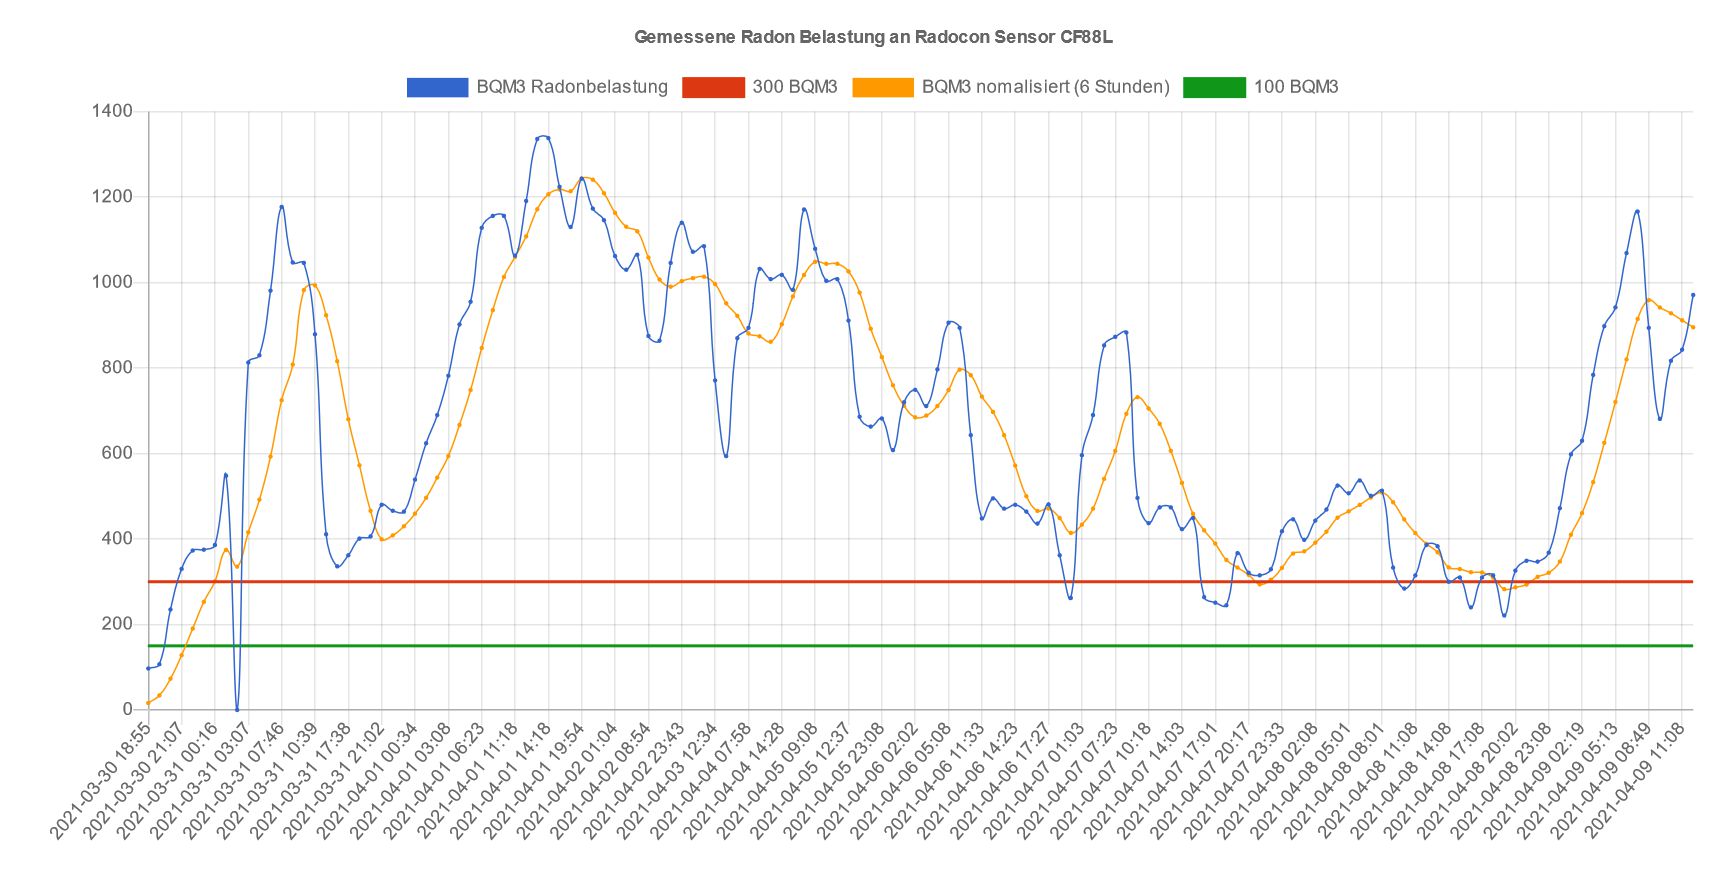
chart as it is

Sebastian Morales commented on Apr 13, 2021

Pls try this and let us know the result:

LineChart::create(array(
    ...
    "options" => [
        "scales" => [
            "xAxes" => [
                [
                    "ticks" => ["display" => true],
                ]
            ]
        ]
    ]
));
    

For further ticks configuration pls check this link:

https://www.chartjs.org/docs/latest/axes/#tick-configuration

Frank Wolf commented on Apr 13, 2021

SOLVED

thanks, you pointed me to the right direction!

"options"=>array(
            "scales"=>array(
                "xAxes"=>array(
                    array(
                        "type"=>"time",
                        "time"=> array(
                            "unit"=>"day",
                            "unitStepSize"=>1,    
                            "displayFormats"=> array(
                                    'day'=> 'DD MMM',
                            )    
                        )                   
                        //  "ticks"=>array(
                        //       "display"=>false
                        //       "reverse"=> true
                        //  )         
                    )
                ),
            )
        )

Build Your Excellent Data Report

Let KoolReport help you to make great reports. It's free & open-source released under MIT license.

Download KoolReport View demo
solved

ChartJS