KoolReport's Forum

Official Support Area, Q&As, Discussions, Suggestions and Bug reports.
Forum's Guidelines

GoogleChart: Cube #202

Open bysystem opened this topic on on Jan 25, 2018 - 5 comments

bysystem commented on Jan 25, 2018

Dear support team,

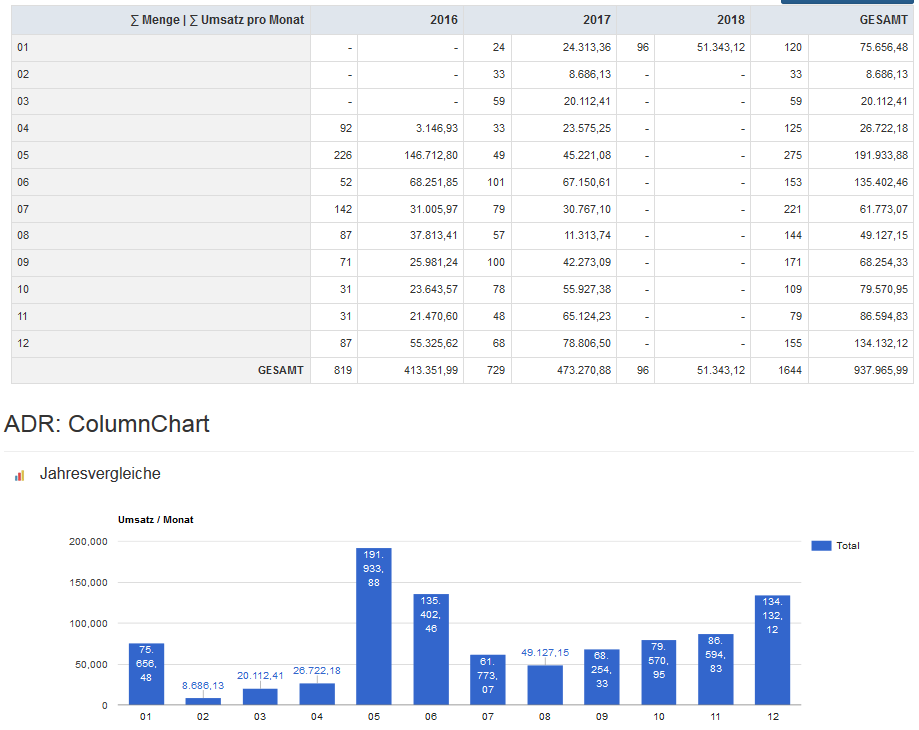
with my following setup I get a result via cube piping (dataStore('ADR.FIRMENCHART')) a google chart where the TOTAL values (database field "Wert") are shown for each "Month" (see the first screenshot below).

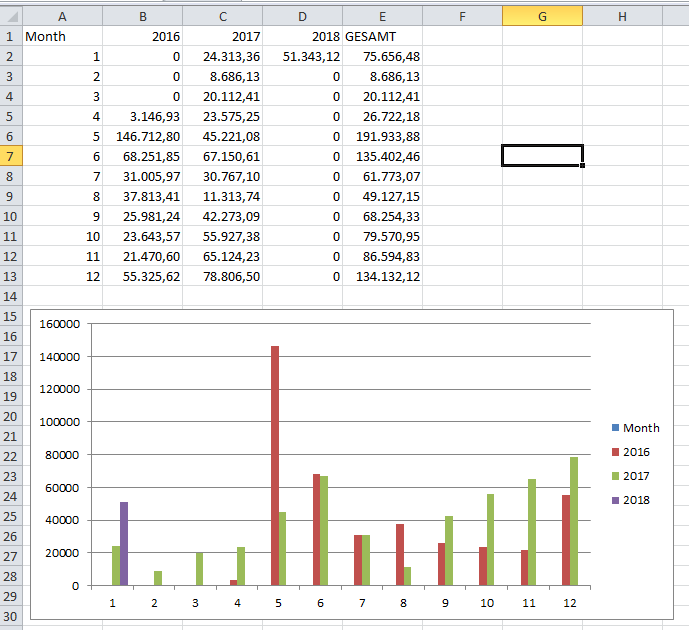
But what i would like to generate a GoogleChart for each "Year" the "Wert" value with corresponding "Month" (see the secon screenshot from Excel).

		// FIRMENDETAIL-PIVOT: Umsatz/Menge aggregieren
		if(count($this->params["Auftrg"])>0){$whereAuftrg="Auftrg IN (:Auftrg) ";}else{$whereAuftrg="Auftrg IS NOT NULL ";}	

		//$node = $this->src('adr')
		$this->src('adr')
			->query("
			SELECT Auftrg, NameWarenem, NameAuftr, StrasAuftr, PlzAuftr, OrtAuftr, Produktname, FakdatZBCP, Ag2, AG1Beschreibung, AG2Beschreibung, AuftrM, Wert
			FROM Reporting.TOTAL_v
			
			WHERE			
				$whereAuftrg
				
		")->params(array(
			":Auftrg"=>$this->params["Auftrg"],
		))		
	
		->pipe(new Custom(function($data){
			$data["Wert"] = trim(str_replace(",",".",$data["Wert"]));
			return $data;
		}))
	
		->pipe(new ColumnMeta(array(
            "Wert"=>array(
				"align"=>"right",
                "type"=>"number",
                "prefix"=>"",
				"suffix"=>"",
				"decimals"=>2,
				"thousandSeparator"=>".",
				"decimalPoint"=>",",
            )
		)))	
		
		->pipe(new Map(array(
			  '{value}' => function($row, $metaData) {
				$date = explode('.', $row['FakdatZBCP']);
				$row['Year'] = $date[0];
				$row['Month'] = $date[1];
				return array($row);
			  },
			  '{meta}' => function($metaData) {
				$metaData['columns']['Year'] = array(
				  'type' => 'number',
				);
				$metaData['columns']['Month'] = array(
				  'type' => 'number',
				);
				return $metaData;
			  }
			)))		
			
		->saveTo($node);
		
		$node->pipe(new Pivot(array(
				"dimensions"=>array(
					"column" => "Year",
					"row" => "Month",
				),
				"aggregates" => array(
					"sum" => "AuftrM, Wert",            
				)
			)))	
		->pipe($this->dataStore('ADR.FIRMENDETAIL'));	


		$node->pipe(new Limit(array(1)))
		->pipe($this->dataStore('Reporting.FIRMENMETADATEN'));	

        $node->pipe(new Cube(array(
            "row"=>"Month",
            "sum"=>"Wert",
        )))
		->pipe(new ColumnMeta(array(
			"{{all}}"=>array(
				"label"=>"Total",
			)
		)))	
        ->pipe(new Sort(array(
            "Month"=>"asc"
        )))			
		->pipe($this->dataStore('ADR.FIRMENCHART'));

My view.php:

		<?php
			google\ColumnChart::create(array(
				"dataStore"=>$this->dataStore('ADR.FIRMENCHART'),

				"columns"=>array(
					"Month",
					"{{all}}"=>array(
						"type"=>"number",
						"prefix"=>"",
						"suffix"=>"",
						"decimals"=>2,
						"thousandSeparator"=>".",
						"decimalPoint"=>",",
						"annotation"=>function($row)
						{
							//return "$".number_format($row["{{all}}"]);
							return number_format($row["{{all}}"],2,',','.');
						},
					)
				),
			
				"options"=>array(
					"title"=>"Umsatz / Monat",
					"animation"=>array(
						"startup"=>true,
						"duration"=>2000,
						"easing"=>'out',
					),
					"isStacked"=>true,
					"orientation"=>"horizontal", //vertical
				),
				"width"=>"100%",
			));
		?>

Screenshot1 (how it's now with the code above):

Screenshot 2 (how it should be):

Any idea how to do this?

Kind regards,

bysystem commented on Jan 29, 2018

Dear support team,

may I ask you to give me a hint related to my issue above?

Kind regards,

David Winterburn commented on Jan 30, 2018

Hi bysystem,

To create a multi-series chart like in image 2, you could either remove the "{{all}}" column by using:

->pipe(new RemoveColumn(array(
      "{{all}}"
    )))

and then don't specify the "columns" property of the column chart (the chart will then use all remaining columns: months and years). Or instead please try replacing the "{{all}}" column with the years column when creating the chart. Please try either way and let us know if it works for you. Thanks!

bysystem commented on Jan 30, 2018

Dear Dave,

thx for your response. I just have adde the RemoveColumns process as follows:

        $node->pipe(new Cube(array(
            "row"=>"Month",
            "sum"=>"Wert",
        )))
		->pipe(new ColumnMeta(array(
			"{{all}}"=>array(
				"label"=>"Total",
			)
		)))	
        ->pipe(new Sort(array(
            "Month"=>"asc"
        )))	
	
		->pipe(new RemoveColumn(array(
			  "{{all}}"
			)))	
			
		->pipe($this->dataStore('ADR.FIRMENCHART'));

And commented out the columns property in the chart view:

			<?php
				google\ColumnChart::create(array(
					"dataStore"=>$this->dataStore('ADR.FIRMENCHART'),
/*
					"columns"=>array(
						"Month",
						"{{all}}"=>array(
						//"Years"=>array(
							"type"=>"number",
							"prefix"=>"",
							"suffix"=>"",
							"decimals"=>2,
							"thousandSeparator"=>".",
							"decimalPoint"=>",",
							"annotation"=>function($row)
							{
								//return "$".number_format($row["{{all}}"]);
								return number_format($row["{{all}}"],2,',','.');
							},
						)
					),
*/				
					"options"=>array(
						"title"=>"Umsatz / Monat",
						"animation"=>array(
							"startup"=>true,
							"duration"=>2000,
							"easing"=>'out',
						),
						"isStacked"=>true,
						"orientation"=>"horizontal", //vertical
					),
					"width"=>"100%",
				));
			?>	

In my front end I get now the error message:

"Not enough columns given to draw the requested chart."

Any idea what could be the reason?

David Winterburn commented on Jan 31, 2018

Hi bysystem,

I think the problem is because of the Cube process lacking a "column" dimension:

$node->pipe(new Cube(array(
            "row"=>"Month",
            "sum"=>"Wert",
        )))

When you set up only a "row" dimension, the final result will only have 2 columns: Month and {{all}}. Then you remove {{all}}, thus not enough columns for Google Chart. You may want to add "Year" to the Cube process like this:

$node->pipe(new Cube(array(
            "row"=>"Month",
            "column"=>"Year",
            "sum"=>"Wert",
        )))

Please try it and let us know the result. Thanks!

bysystem commented on Jan 31, 2018

Dear Dave,

thx a lot for this important hint! Now it works exactly how I want!

Kind regards,

Build Your Excellent Data Report

Let KoolReport help you to make great reports. It's free & open-source released under MIT license.

Download KoolReport View demo
solved

Cube