KoolReport's Forum

Official Support Area, Q&As, Discussions, Suggestions and Bug reports.
Forum's Guidelines

Chartjs combo chart line chart instead of area chart #1907

Closed ankit raj opened this topic on on Feb 17, 2021 - 4 comments

ankit raj commented on Feb 17, 2021

Hi , I was using the example mentioned in the website to create a combo chart with bar and line chart , but even in example , although the property is passed as line :

 "config"=>array(
            "type"=>"line",//Line chart is draw
            "borderWidth"=>3,
        )

It is drawing an area chart as seen in the image:
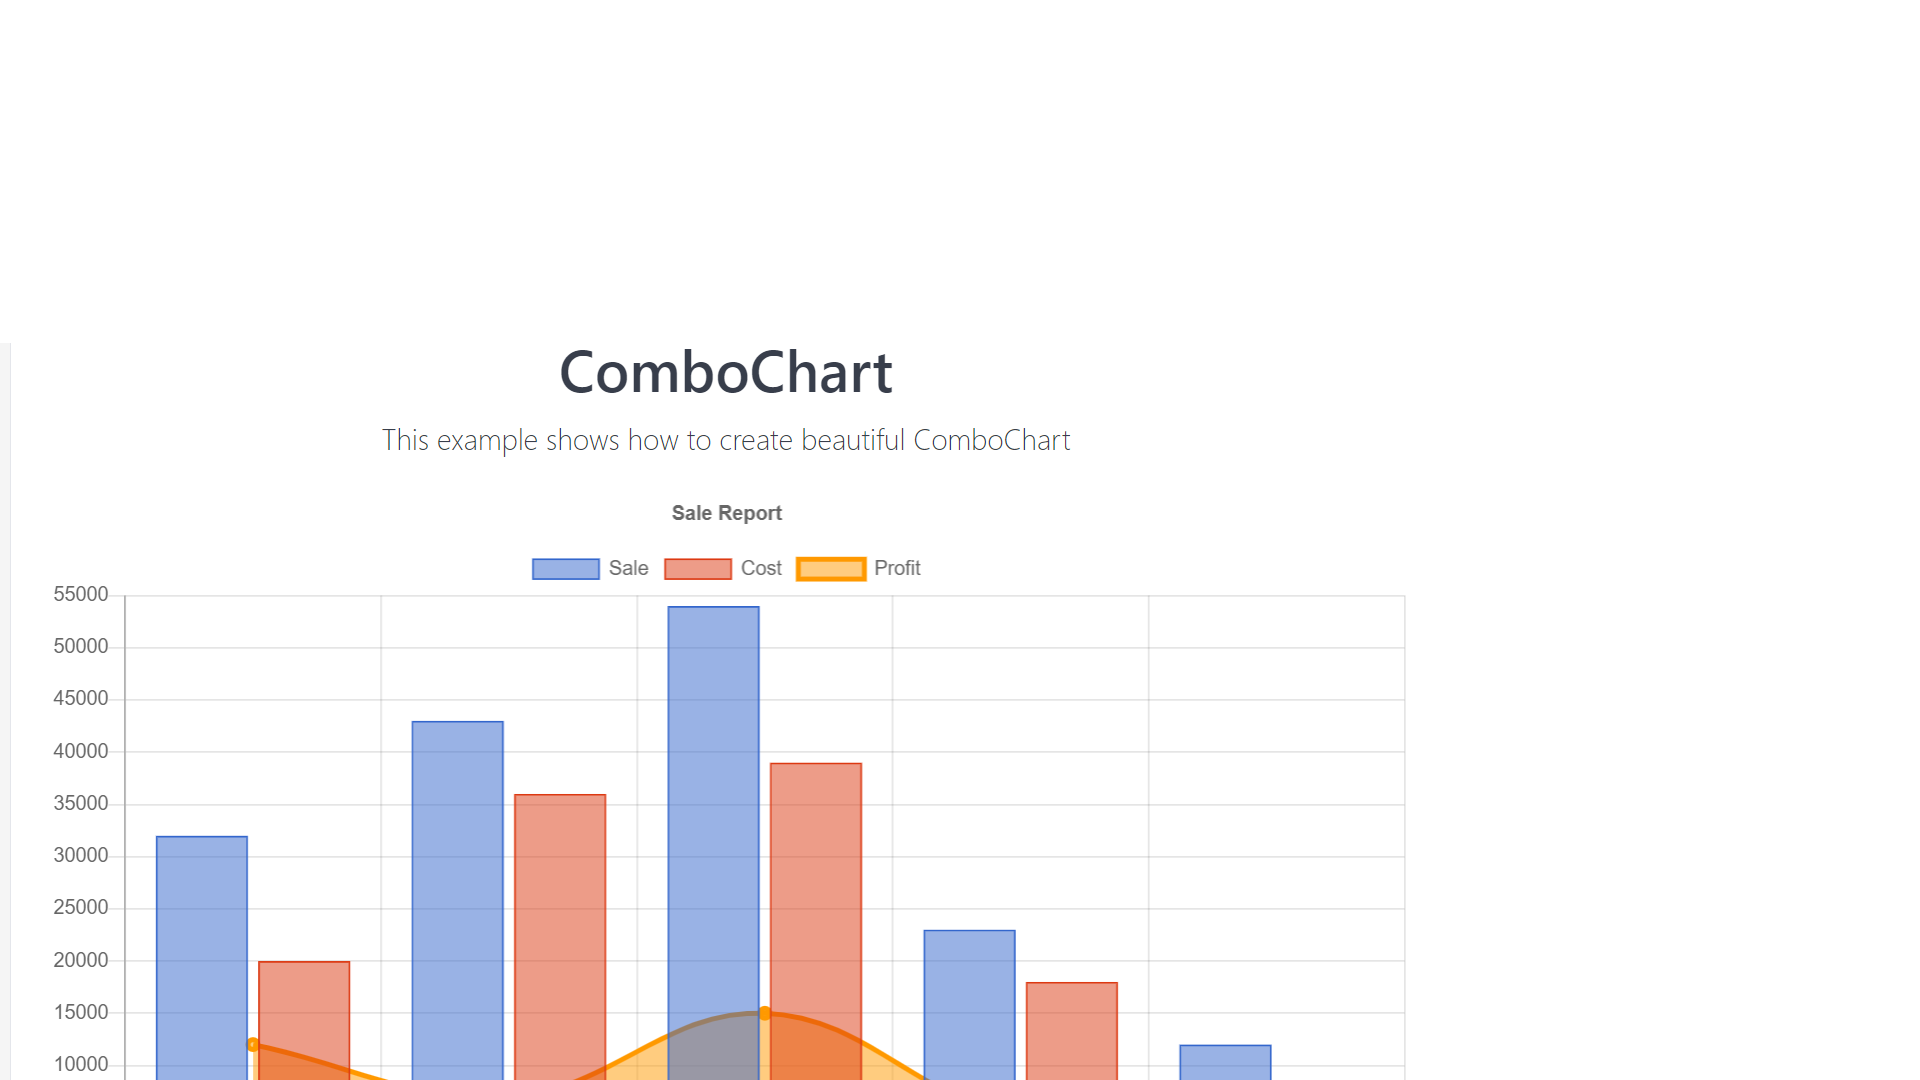
How can i make it line instead of area chart?

ankit raj commented on Feb 22, 2021

hi @koolreport , any update on this?

ankit raj commented on Mar 9, 2021

Hey guys , any update on this issue? Its been almost a month

Sebastian Morales commented on Mar 10, 2021

Ankit, pls use a totally transparent color like this:

                "config"=>array(
                    "type"=>"line",//Line chart is draw
                    "borderWidth"=>3,
                    "backgroundColor" => "rgba(0, 0, 0, 0)", //rgba with the last value = 0 opacity, i.e 100% transparent
                )

Hope it works. Rgds,

ankit raj commented on Mar 11, 2021

Thanks. works fine

Build Your Excellent Data Report

Let KoolReport help you to make great reports. It's free & open-source released under MIT license.

Download KoolReport View demo
help needed

ChartJS