KoolReport's Forum
Official Support Area, Q&As, Discussions, Suggestions and Bug reports.
Forum's Guidelines
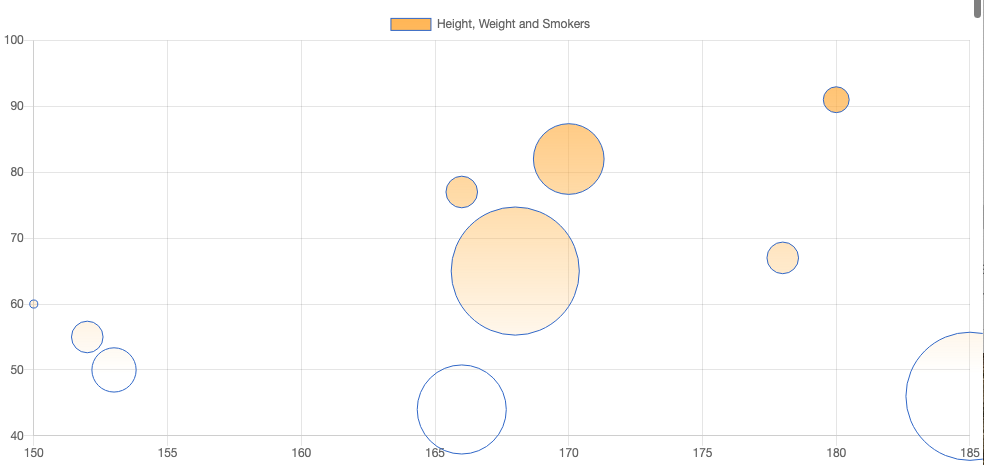
Gradient or image in background (chartjs) #1846
At the moment it's not easy to set an option for Chartjs' bubble chart to have a gradient background. Please try the following method:
1 . Create a file call MyBubbleChart.php in koolreport/chartjs directory with the following content:
<?php

namespace koolreport\chartjs;
use \koolreport\core\Utility;

class MyBubbleChart extends BubbleChart
{
    protected function processData()
    {
        $datasets = array();
        foreach($this->series as $i=>$series)
        {
            $columnKeys = array();
            $dataset = array(
                "label"=>"Series $i",
                "borderColor"=>$this->getColor($i),
                "backgroundColor"=>"function getGradient() {
                    var ctx = document.getElementById('{$this->name}').getContext('2d');
                    var gradient = ctx.createLinearGradient(0, 0, 0, 400);
                    gradient.addColorStop(0, 'rgba(250,174,50,1)');  //modify these lines for your preferred gradient
                    gradient.addColorStop(1, 'rgba(250,174,50,0)');
                    return gradient;
                }",
            );
            foreach($series as $item)
            {

                if(gettype($item)=="string")
                {
                    array_push($columnKeys,$item);
                }
                elseif(gettype($item)=="array")
                {
                    $dataset = array_merge($dataset,$item);
                }
            }
            $dataset["data"] = array();
            $this->dataStore->popStart();
            while($row = $this->dataStore->pop())
            {
                array_push($dataset["data"],array(
                    "x"=>$row[$columnKeys[0]],
                    "y"=>$row[$columnKeys[1]],
                    "v"=>$row[$columnKeys[2]],
                    "s"=>Utility::get($dataset,"scale",$this->scale),
                ));
            }
            array_push($datasets,$dataset);
        }
        return array(
            "datasets"=>$datasets,
        );
    }

}
Then in your report view use \koolreport\chartjs\MyBubbleChart widget instead of \koolreport\chartjs\BubbleChart.
Build Your Excellent Data Report
Let KoolReport help you to make great reports. It's free & open-source released under MIT license.
Download KoolReport View demo