KoolReport's Forum

Official Support Area, Q&As, Discussions, Suggestions and Bug reports.
Forum's Guidelines

DataTable export to excel #1742

Closed Ron opened this topic on on Dec 1, 2020 - 15 comments

Ron commented on Dec 1, 2020

Hi,

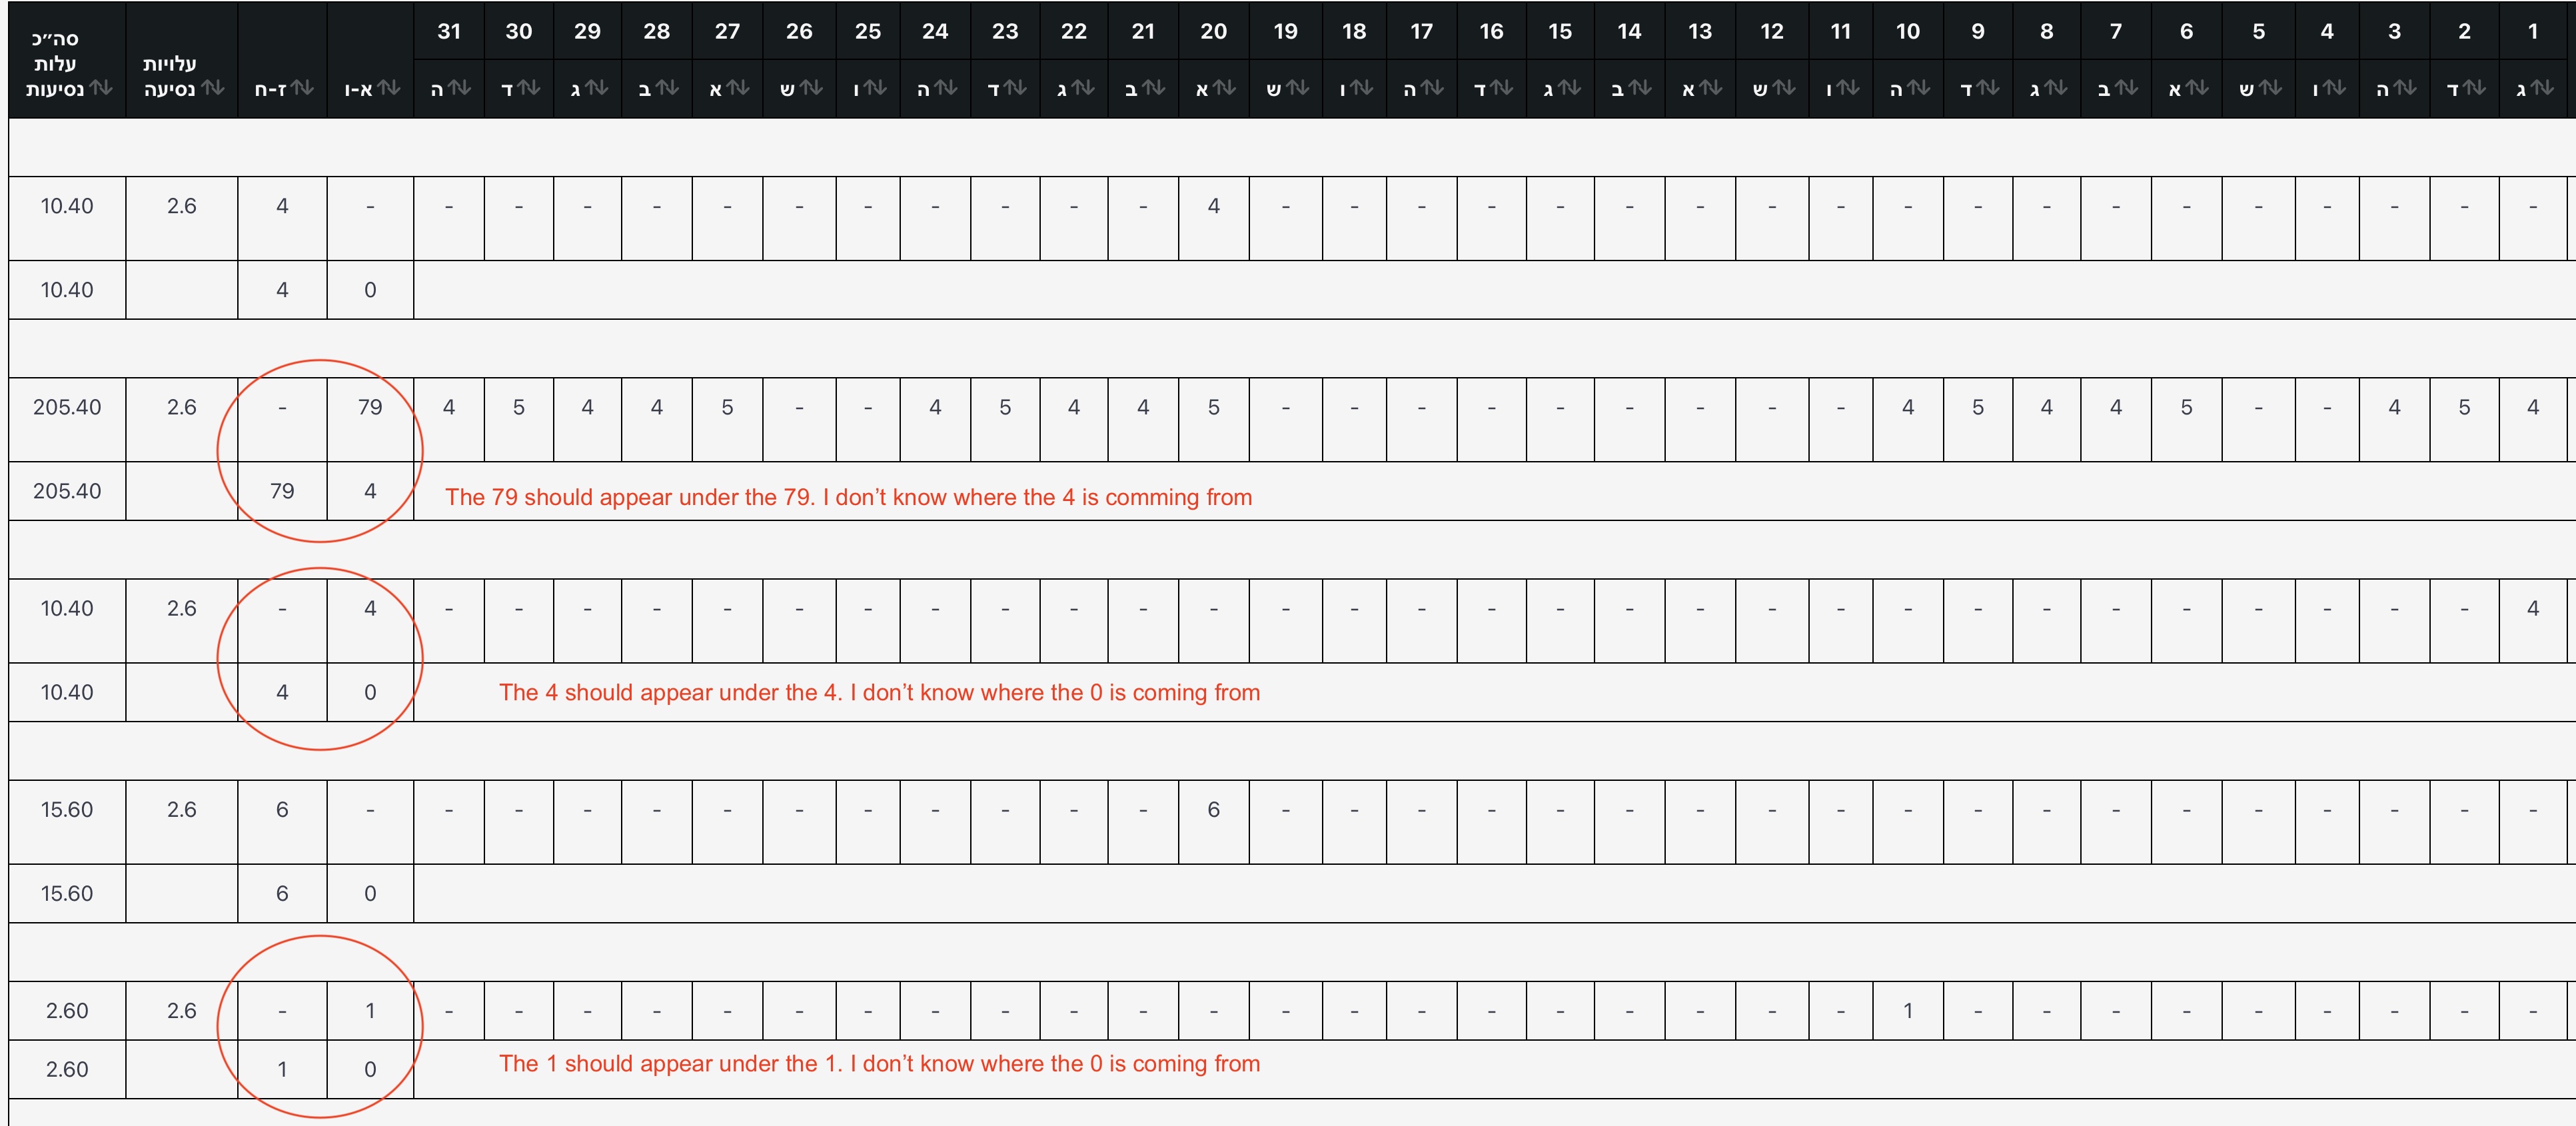
I have a datatable report that I want to be able to export to excel. please note the the datatable includes a merged columns and rows.

This is the code of the report

DataTables::create(array(
            "dataSource"=>$this->dataStore("st"),
            "options"=>array(
                "searching"=>false,
                "paging"=>false,
                'columnDefs' => array(
        			array(
        				'visible' => false,
        				'targets' => [$this->monthDays+6], //hide the first column
        			)
        		),
        		'rowGroup' => [
        		     //'dataSrc' => [0], //10 is the order of the column you want to group
        		     'endRender' => "function ( rows, group ) {
                         var totalA = rows
                            .data()
                            .pluck($this->monthDays+7)
                            .reduce( function (a, b) {
                                return a + b.replace(/[^\d]/g,'')*1;
                            }, 0);

                        var totalB = rows
                           .data()
                           .pluck($this->monthDays+8)
                           .reduce( function (a, b) {
                               return a + b.replace(/[^\d]/g,'')*1;;
                           }, 0);

                        var totalTravelCost = rows
                            .data()
                            .pluck($this->monthDays+10)
                            .reduce( function (a, b) {
                                return a + b*1;
                            }, 0);
                        totalTravelCost = $.fn.dataTable.render.number(',', '.', 2).display( totalTravelCost );

                        return $('<tr/>')
                            .append( '<td colspan='+($this->monthDays+6)+'>סה״כ שעות מילוי מקום למורה '+group+'</td>' )
                            .append( '<td class=text-center>'+totalA+'</td>' )
                            .append( '<td class=text-center>'+totalB+'</td>' )
                            .append( '<td></td>' )
                            .append( '<td class=text-center>'+totalTravelCost+'</td>' );
                    }"
        		],
            ),
            'complexHeaders' => true,
            'headerSeparator' => ' - ',
            'cssClass'=>array(
                'table'=>'table table-bordered',
                'tr'=>'cssItem',
                'td'=>function($row,$colName)
                {
                    return in_array($colName, array('substitute_teacher_id','id_number','full_address','bank_account','teacher_id','group_name')) ? 'text-right' : 'text-center';
                },
                'th'=>function($colName)
                {
                    return in_array($colName, array('substitute_teacher_id','id_number','full_address','bank_account','teacher_id','group_name')) ? 'table-dark text-right' : 'table-dark text-center';
                },
            ),
        ));
        echo '<div class="footer print-only">Footer</div>';
        ?>
David Winterburn commented on Dec 2, 2020

Hi Ron,

If you meant to export table to excel using row group please have a look at our excel Table widget's rowGroup property:

https://www.koolreport.com/docs/excel/excel_widgets/#table-widget-(version-%3E=-6.0.0)-rowgroup-(version-%3E=-8.0.0)

Just use excel Table in your export excel view file (says MyReportExcel.view.php) with this property. If what you want is different please let us know. Thanks!

Ron commented on Dec 4, 2020

I don't think that would help. I am using dataTable widget and not table.

David Winterburn commented on Dec 8, 2020

Hi Ron,

DataTables is for rendering content to browser. You were asking to export to excel and keep row grouping like in DataTables, weren't you? In that case what I guided is using the excel/Table widget (in report excel view) which accidentally has just got a row grouping option.

If I misunderstood anything let me know. Thanks!

Ron commented on Dec 8, 2020

its not so understood in the link that you supplied I do i make the shift from datatable web rendering to table/excel export. I am adding the report setup function beside the report view that we already have above. can you please assist me in converting the code that it will export to excel:

function setup()
    {
        $this->month = date('m', strtotime($this->params["date"]));
        $this->year = date('Y', strtotime($this->params["date"]));
        $this->monthDays = cal_days_in_month(CAL_GREGORIAN, $this->month, $this->year);
        $this->src('tts')
        ->query('CALL getSubstituteTeacherHourListPerMonth(:year, :date)')
        ->params(array(
            ":year"=>$this->params["year"],
            ":date"=>$this->params["date"]
        ))
        ->pipe(new \koolreport\processes\Map(array(
            "{value}" => function($row, $metaData, $index, $mapState) {
                $days = array('א','ב','ג','ד','ה','ו','ש');
                //$month = date('m', strtotime($this->params["date"]));
                //$year = date('Y', strtotime($this->params["date"]));
                $newRow = [];
                foreach ($row as $k => $v) {
                    if (is_numeric($k))
                        $k = 1*$k;
                        if ($k >= 1 && $k <= 31) { //i.e $k is month day
                            $weekday = date('w', strtotime($this->year.'-'.$this->month.'-'.$k));
            		        $newRow[$k. " - " . $days[$weekday]] = $row[$k];
                        } else {
                            //echo $k."<br>";
                            $originalK = $k;
                            if ( in_array($k, array('substitute_teacher_id','id_number','full_address','bank_account','teacher_id','hour_group_id', 'cost', 'total_travel_cost') ) ) {
                                $k = lang('tts.'.$k);
                            }
                            $newRow[$k] = $row[$originalK];
                        }
                    }
                    return $newRow;
                }
        )))
        ->pipe($this->dataStore("st"));
    }
David Winterburn commented on Dec 9, 2020

Hi Ron,

Which column do you want to do row grouping on when excel exporting? I think the syntax for excel Table is pretty straightforward:

    \koolreport\excel\Table::create(array(
        ...
        "rowGroup" => [
            "customerName" => [] //row grouping on "customerName" column
        ]
    )); 
Ron commented on Dec 29, 2020

Hi David,

above i posted the code of the view. you can see that there are several totals are calculated. I have issues with that. the calculation are not done in the right place. please see attached the report output and problems.

David Winterburn commented on Dec 30, 2020

Hi Ron,

Please post the excel export view code of yours. Thanks!

Ron commented on Dec 30, 2020

Hi David, This report is not exporting to excel yet. it is DataTable widget.

DataTables::create(array(
            "dataSource"=>$this->dataStore("st"),
            "options"=>array(
                "searching"=>false,
                "paging"=>false,
                'columnDefs' => array(
        			array(
        				'visible' => false,
        				'targets' => [$this->monthDays+6], //hide the first column
        			)
        		),
        		'rowGroup' => [
        		     //'dataSrc' => [0], //10 is the order of the column you want to group
        		     'endRender' => "function ( rows, group ) {
                         var totalA = rows
                            .data()
                            .pluck($this->monthDays+7)
                            .reduce( function (a, b) {
                                return a + b.replace(/[^\d]/g,'')*1;
                            }, 0);

                        var totalB = rows
                           .data()
                           .pluck($this->monthDays+8)
                           .reduce( function (a, b) {
                               return a + b.replace(/[^\d]/g,'')*1;;
                           }, 0);

                        var totalTravelCost = rows
                            .data()
                            .pluck($this->monthDays+10)
                            .reduce( function (a, b) {
                                return a + b*1;
                            }, 0);
                        totalTravelCost = $.fn.dataTable.render.number(',', '.', 2).display( totalTravelCost );

                        return $('<tr/>')
                            .append( '<td colspan='+($this->monthDays+6)+'>סה״כ שעות מילוי מקום למורה '+group+'</td>' )
                            .append( '<td class=text-center>'+totalA+'</td>' )
                            .append( '<td class=text-center>'+totalB+'</td>' )
                            .append( '<td></td>' )
                            .append( '<td class=text-center>'+totalTravelCost+'</td>' );
                    }"
        		],
            ),
            'complexHeaders' => true,
            'headerSeparator' => ' - ',
            'cssClass'=>array(
                'table'=>'table table-bordered',
                'tr'=>'cssItem',
                'td'=>function($row,$colName)
                {
                    return in_array($colName, array('substitute_teacher_id','id_number','full_address','bank_account','teacher_id','group_name')) ? 'text-right' : 'text-center';
                },
                'th'=>function($colName)
                {
                    return in_array($colName, array('substitute_teacher_id','id_number','full_address','bank_account','teacher_id','group_name')) ? 'table-dark text-right' : 'table-dark text-center';
                },
            ),
        ));
        echo '<div class="footer print-only">Footer</div>';
        ?>
David Winterburn commented on Dec 30, 2020

Change the colspan value of each of your totals if you want them to align correctly. Experiment with it several times to find the correct colspan values.

Ron commented on Dec 30, 2020

Thanks david. It helped me very much. Now regards the export to Excel. I want to have a button like "Export to Excel" after I rendered the report and once the user clicks on it it will export the entire report to excel file. I need your guidance how to do it. using you documentation is very difficult to figure out what exactly I need to do. can I simply post both report files and get your explanation?

David Winterburn commented on Dec 31, 2020

I would suggest copying and modifying our excel template export example according to your needs:

https://www.koolreport.com/examples/reports/excel/table/

If you have any question just post it here. Thanks!

Ron commented on Dec 31, 2020

I am getting the following error after file is generated

Excel cannot open the file 'MyReport.xlsx' because the file format or file extension is not valid. Verify that the file has not been corrupted and that the file extension matches the format of the file.

David Winterburn commented on Jan 4, 2021

Please post your excel template view for us to check it for you. Thanks!

Ron commented on Jan 4, 2021

this is the view page code

<?php
    //MyReport.view.php
    use \koolreport\datagrid\DataTables;
?>
<html>
    <head>
        <title><?php echo lang('tts.report_substitute_teachers'); ?></title>
        <link rel="stylesheet" href="<?php echo site_url('../assets/css/print.css')?>">
        <style>
            @media print { @page {size: landscape;} body { writing-mode: tb-rl;} }
            table.table-bordered{
                border:1px solid black!important;
                margin-top:20px;
            }
            table.table-bordered > thead > tr > th{
                border:1px solid black!important;
            }
            table.table-bordered > tbody > tr > td{
                border:1px solid black!important;
            }
            @media print {
                .hidden-print {
                    display: none !important;
                }
            }
        </style>
    </head>
    <body DIR="RTL" >
        <div class="row d-print-none">
            <div class="col text-center">
                <button id="print" class="btn btn-success" href="<?php echo site_url('reports'); ?>" onclick="javascript: window.print()">
                    <?php echo lang('tts.print'); ?>
                </button>
                <a class="btn btn-secondary mr-2" href="<?php echo site_url('reports'); ?>">
                    <?php echo lang('tts.back'); ?>
                </a>
            </div>
        </div>
        <?php
        echo '<div class="header print-only"><img src="'.site_url('../assets/img/'.(isset($_SESSION['institute_number']) ? $_SESSION['institute_number'].'.png' : "logo.svg")).'" height="38" /></div>';
        ?>
        <h1 class="text-center"><?php echo lang('tts.report_substitute_teachers'); ?></h1>
        <h3 class="text-center"><u><?php echo lang('tts.for_month').' '.lang('tts.'.date('F', mktime(0, 0, 0, $this->month, 10))).' '.$this->year;  ?></u></h3>
        <?php
        DataTables::create(array(
            "dataSource"=>$this->dataStore("st"),
            "options"=>array(
                "searching"=>true,
                "paging"=>true,
                'columnDefs' => array(
        			array(
        				'visible' => false,
        				'targets' => [$this->monthDays+6,2,3], //hide the first column
        			)
        		),
        		'rowGroup' => [
        		     //'dataSrc' => [0], //10 is the order of the column you want to group
        		     'endRender' => "function ( rows, group ) {
                         var totalA = rows
                            .data()
                            .pluck($this->monthDays+7)
                            .reduce( function (a, b) {
                                return a + b.replace(/[^\d]/g,'')*1;
                            }, 0);

                        var totalB = rows
                           .data()
                           .pluck($this->monthDays+8)
                           .reduce( function (a, b) {
                               return a + b.replace(/[^\d]/g,'')*1;
                           }, 0);

                        var totalTravelCost = rows
                            .data()
                            .pluck($this->monthDays+10)
                            .reduce( function (a, b) {
                                return a + b*1;
                            }, 0);
                        totalTravelCost = $.fn.dataTable.render.number(',', '.', 2).display( totalTravelCost );

                        return $('<tr/>')
                            .append( '<td colspan='+($this->monthDays+4)+'><b>סה״כ שעות מילוי מקום למורה <i>'+group+'</i><b></td>' )
                            .append( '<td class=text-center><b>'+totalA+'</b></td>' )
                            .append( '<td class=text-center><b>'+totalB+'</b></td>' )
                            .append( '<td></td>' )
                            .append( '<td class=text-center bg-success><b>'+totalTravelCost+'</b></td>' );
                    }"
        		],
            ),
            'complexHeaders' => true,
            'headerSeparator' => ' - ',
            'cssClass'=>array(
                'table'=>'table table-bordered',
                'tr'=>'cssItem',
                'td'=>function($row,$colName)
                {
                    return in_array($colName, array('substitute_teacher_id','id_number','full_address','bank_account','teacher_id','group_name')) ? 'text-right' : 'text-center';
                },
                'th'=>function($colName)
                {
                    return in_array($colName, array('substitute_teacher_id','id_number','full_address','bank_account','teacher_id','group_name')) ? 'table-dark text-right' : 'table-dark text-center';
                },
            ),
        ));
        echo '<div class="footer print-only">Footer</div>';
        ?>
    </body>
</html>
David Winterburn commented on Jan 5, 2021

You can't use your report web view for excel view template export. The excel view must follow the 2-level div structure strictly so that the exporter knows exactly where to put the text, table, chart widgets in excel sheet:

https://www.koolreport.com/docs/excel/export_to_excel/#excel-export-template-(version-%3E=-6.0.0)

Build Your Excellent Data Report

Let KoolReport help you to make great reports. It's free & open-source released under MIT license.

Download KoolReport View demo
None yet

None