KoolReport's Forum

Official Support Area, Q&As, Discussions, Suggestions and Bug reports.
Forum's Guidelines

Howto create dynamic columns definitions with an annotation or tooltips functions in Google line chart #1734

Open Hernan Gonzalez Pablo opened this topic on on Nov 25, 2020 - 10 comments

Hernan Gonzalez Pablo commented on Nov 25, 2020

Hi.

I need replace the columns definition with my own dynamic definition.

LineChart::create(array(
    "dataSource"=>$this->DataStore("result_all"),
    "columns"=>array(
            "D_DESC"=>array(
                    "type"=>"date"
            ),
            "TOTAL_0"=>array(
                    "label"=>"EMERGENCIA",
                    "type"=>"number",
                    "annotation"=>function($row) {return $row["TOTAL_0"];}
            ))
));

to

LineChart::create(array(
    "dataSource"=>$this->DataStore("result_all"),
    "columns"=>$col_graph1
));

This is how I made my array.

foreach ($col_temp as $fila){
    $col_graph1[$fila]=array(
        "type"=>"number",
	"label"=>label($fila),
	"annotation"=>function($row) {return number_format($row['.$fila.']);});
    }

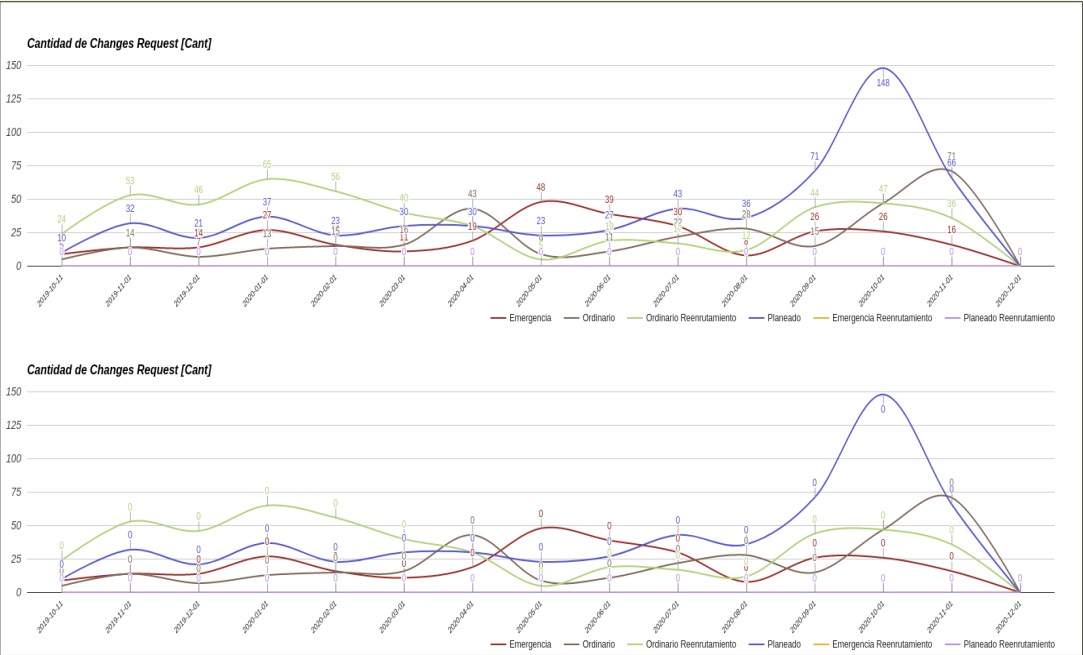
And this is the result

Array ( [D_DESC] => Array ( [type] => date ) [TOTAL_0] => Array ( [type] => number [label] => Emergencia [annotation] => function($row) {return $row["TOTAL_0"];} ) )

but the function declared for the annotation does not work, write it literally

How should I define it for it to work?

Regards.

David Winterburn commented on Nov 30, 2020

Hi Hernan,

The "annotation" property of Google chart widget must be a string and can not be a function like that. I also don't understand fully your function because "annotation" is column based while your function is row based. Please explain with an example if it's possible. Thanks!

Hernan Gonzalez Pablo commented on Nov 30, 2020

ok..

I want it to graph the value of the field, but when I define it as a string it shows me this

I put it as a string directly and as a result of a function like this

function annotation1($nombre){

$result = 'function($row) {return $row["'.$nombre.'"];}';
return $result;}
David Winterburn commented on Dec 1, 2020

I still haven't understood your intend. The "annotaion" is defined for each column which can has many rows. If you want to dynamically set "annotation" based on $row["'.$nombre.'"], which row do you want to get it from.

For a clearer view, please post your sample data used for you chart. Thanks!

Hernan Gonzalez Pablo commented on Dec 2, 2020

ok.. sorry...

I need to make a dynamic array since I don't know in advance how many columns I have. I define column X (which is fixed) and add the columns Y (which are variables) with a foreach loop.

foreach ($col_temp as $fila){

$col_graph1[$fila]=array(
    "type"=>"number",
"annotation"=>function($row) {return number_format($row['.$fila.']);});
}

As you can see $fila is a variable that contains the name of the column. But I don't know how I should write the "annotation" function to show me the value of that field.

As an example for the case that $fila is the field "DATO_01", the array should be

$col_graph1[DATO_01]=array(

    "type"=>"number",
"annotation"=>function($row) {return number_format($row['DATO_01']);});

I don't know how I should write it in the loop since it doesn't work this way. In the previous graph you can see the result.

Regards.

David Winterburn commented on Dec 4, 2020

Hi Hernan,

How about using the "use" keyword for anonymous function:

    "annotation"=>function($row) use ($fila) {return number_format($row['.$fila.']);});

Hope this helps your case. Thanks!

Hernan Gonzalez Pablo commented on Dec 4, 2020

thanks.

to be more explanatory here I leave the view that is correct and the view that gives the dynamic array

the first one works correctly, but the second one that has the dynamic array does not.

first one: * LineChart::create(array(

				"dataSource"=>$this->DataStore("result_all"),
				"columns"=>array(
					"D_DESC"=>array(
						"type"=>"date"
					),
					"TOTAL_0"=>array(
						"label"=>label(0),
						"type"=>"number",
						"annotation"=>function($row) {return number_format($row["TOTAL_0"]);}
					),
					"TOTAL_1"=>array(
						"label"=>label(1),
						"type"=>"number",
						"annotation"=>function($row) {return number_format($row["TOTAL_1"]);}
					),
					"TOTAL_2"=>array(
						"label"=>label(2),
						"type"=>"number",
						"annotation"=>function($row) {return number_format($row["TOTAL_2"]);}
					),
					"TOTAL_3"=>array(
						"label"=>label(3),
						"type"=>"number",
						"annotation"=>function($row) {return number_format($row["TOTAL_3"]);}
					),
					"TOTAL_4"=>array(
						"label"=>label(4),
						"type"=>"number",
						"annotation"=>function($row) {return number_format($row["TOTAL_4"]);}
					),
					"TOTAL_5"=>array(
						"label"=>label(5),
						"type"=>"number",
						"annotation"=>function($row) {return number_format($row["TOTAL_5"]);}
					)
				)
			));*

second one: * LineChart::create(array(

				"dataSource"=>$this->DataStore("result_all"),
				"columns"=>$col_graph1
			));*

this is the code that builds the dynamic array

  • $col_temp=array("TOTAL_0","TOTAL_1","TOTAL_2","TOTAL_3","TOTAL_4","TOTAL_5");
    		$col_graph1["D_DESC"]=array("type"=>"date");
    		foreach ($col_temp as $fila){
    			$col_graph1[$fila]=array(
    				"type"=>"number",
    				"label"=>label($fila),
    				"annotation"=>function($row) use ($fila) {return number_format($row['.$fila.']);});
    		}
    

    *

Venom commented on Dec 6, 2020

Hi,

You might try to assign an anonymous function to a variable first PHP assign function variable, then put the variable into the array's value.


<?php
    use \koolreport\widgets\google\LineChart;

    $time_sale = array(
        array("month"=>"January","sale"=>32000,"cost"=>40000),
        array("month"=>"February","sale"=>48000,"cost"=>39000),
        array("month"=>"March","sale"=>35000,"cost"=>38000),
        array("month"=>"April","sale"=>40000,"cost"=>37000),
        array("month"=>"May","sale"=>60000,"cost"=>45000),
        array("month"=>"June","sale"=>73000,"cost"=>47000),
        array("month"=>"July","sale"=>80000,"cost"=>60000),
        array("month"=>"August","sale"=>78000,"cost"=>65000),
        array("month"=>"September","sale"=>60000,"cost"=>45000),
        array("month"=>"October","sale"=>83000,"cost"=>71000),
        array("month"=>"November","sale"=>45000,"cost"=>40000),
        array("month"=>"December","sale"=>39000,"cost"=>60000),
    );
?>
<div class="report-content">
    <div class="text-center">
        <h1>LineChart</h1>
        <p class="lead">
            This example shows how to create beautiful LineChart
        </p>
    </div>

    <div style="margin-bottom:50px;">
    <?php

 $col_graph1["month"]=array("type"=>"String"); 
  $col_temp = array('sale',"cost");

  $annotationFunc = function($obj) use ($col_temp)
{   $col = $col_temp[0];   //assume the first column will be used for formatting
    return number_format($obj[$col]);
};
  

  foreach ($col_temp as $fila) {
    $col_graph1[$fila] = array(
        "type" =>"number",
        "label" => $fila,
        "annotation" =>$annotationFunc
    );
  }


    LineChart::create(array(
        "title"=>"Sale vs Cost",
        "options"=>array(
            "curveType"=>"function"
        ),
        "dataSource"=>$time_sale,
        "columns"=>$col_graph1
    ));
    ?>
</div>

</div>
Hernan Gonzalez Pablo commented on Dec 9, 2020

Thanks a lot.

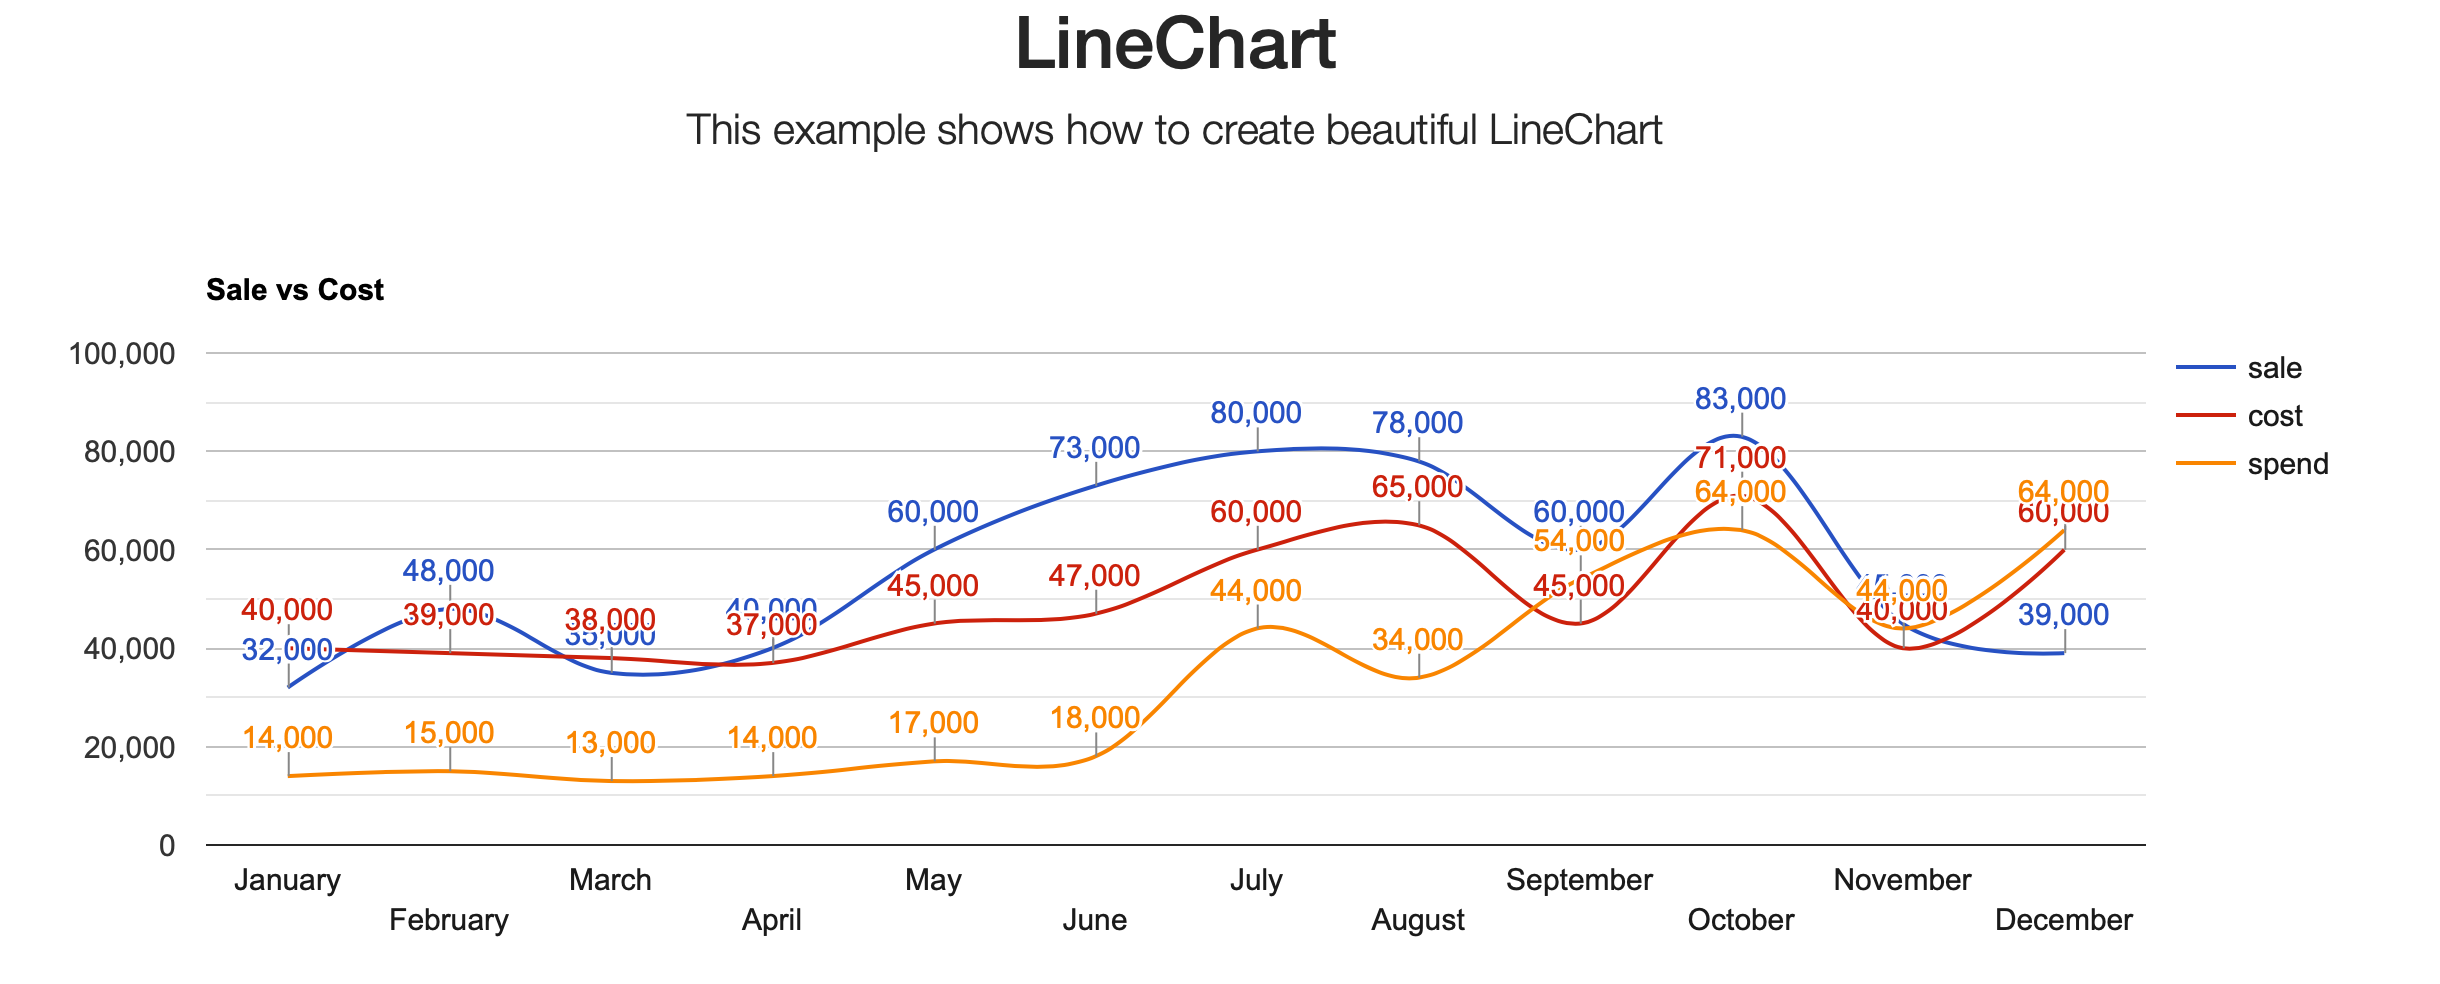
This works fine, but repeats the same value in the "sale" column and in the "cost" column.

How can I make each column have its respective value?

Venom commented on Dec 10, 2020

Updated. Please use the following version.

<?php
    use \koolreport\widgets\google\LineChart;

    $time_sale = array(
        array("month"=>"January","sale"=>32000,"cost"=>40000,"spend"=>14000),
        array("month"=>"February","sale"=>48000,"cost"=>39000,"spend"=>15000),
        array("month"=>"March","sale"=>35000,"cost"=>38000,"spend"=>13000),
        array("month"=>"April","sale"=>40000,"cost"=>37000,"spend"=>14000),
        array("month"=>"May","sale"=>60000,"cost"=>45000,"spend"=>17000),
        array("month"=>"June","sale"=>73000,"cost"=>47000,"spend"=>18000),
        array("month"=>"July","sale"=>80000,"cost"=>60000,"spend"=>44000),
        array("month"=>"August","sale"=>78000,"cost"=>65000,"spend"=>34000),
        array("month"=>"September","sale"=>60000,"cost"=>45000,"spend"=>54000),
        array("month"=>"October","sale"=>83000,"cost"=>71000,"spend"=>64000),
        array("month"=>"November","sale"=>45000,"cost"=>40000,"spend"=>44000),
        array("month"=>"December","sale"=>39000,"cost"=>60000,"spend"=>64000),
    );
?>
<div class="report-content">
    <div class="text-center">
        <h1>LineChart</h1>
        <p class="lead">
            This example shows how to create beautiful LineChart
        </p>
    </div>

    <div style="margin-bottom:50px;">
    <?php

 $col_graph1["month"]=array("type"=>"String"); 
  $col_temp = array('sale',"cost","spend");

  
  foreach ($col_temp as $key=>$fila) {

    $annotationFunc = function($obj) use ($col_temp, $key)
    {   $col = $col_temp[$key];
        return number_format($obj[$col]);
    };


    $col_graph1[$fila] = array(
        "type" =>"number",
        "label" => $fila,
        "annotation" =>$annotationFunc
    );
  }


    LineChart::create(array(
        "title"=>"Sale vs Cost",
        "options"=>array(
            "curveType"=>"function"
        ),
        "dataSource"=>$time_sale,
        "columns"=>$col_graph1
    ));
    ?>
    </div>

</div>
Hernan Gonzalez Pablo commented on Dec 11, 2020

Wonderfull !!!

Thank a lot...

Build Your Excellent Data Report

Let KoolReport help you to make great reports. It's free & open-source released under MIT license.

Download KoolReport View demo
solved

None